Data Analysis
Introduction to Data Science
by Hansjörg Neth
This book provides a gentle introduction to data science for students of any discipline with little or no background in data analysis or computer programming. Based on notions of representation, measurement, and modeling, we examine key data types (e.g., logicals, numbers, text) and learn to clean, summarize, transform, and visualize (rectangular) data. Rather than promoting the latest technologies, we focus on the general goals and principles of data analysis. Reflecting on issues of design and asking why some tool is suited to tackle some task prevents us from getting stuck in niches and prepares us for a world in which many software frameworks can continue to evolve. By reflecting on the relations between representations, tasks, and tools, the course promotes data literacy and cultivates reproducible research practices that precede and enable practical uses of programming or statistics. This book is still being written and revised. It currently serves as a scaffold for a curriculum that is being filled with content as we go along. Read more →
Reproducible Psychological Research with R: Homework Portfolio
by Shannon Joyce
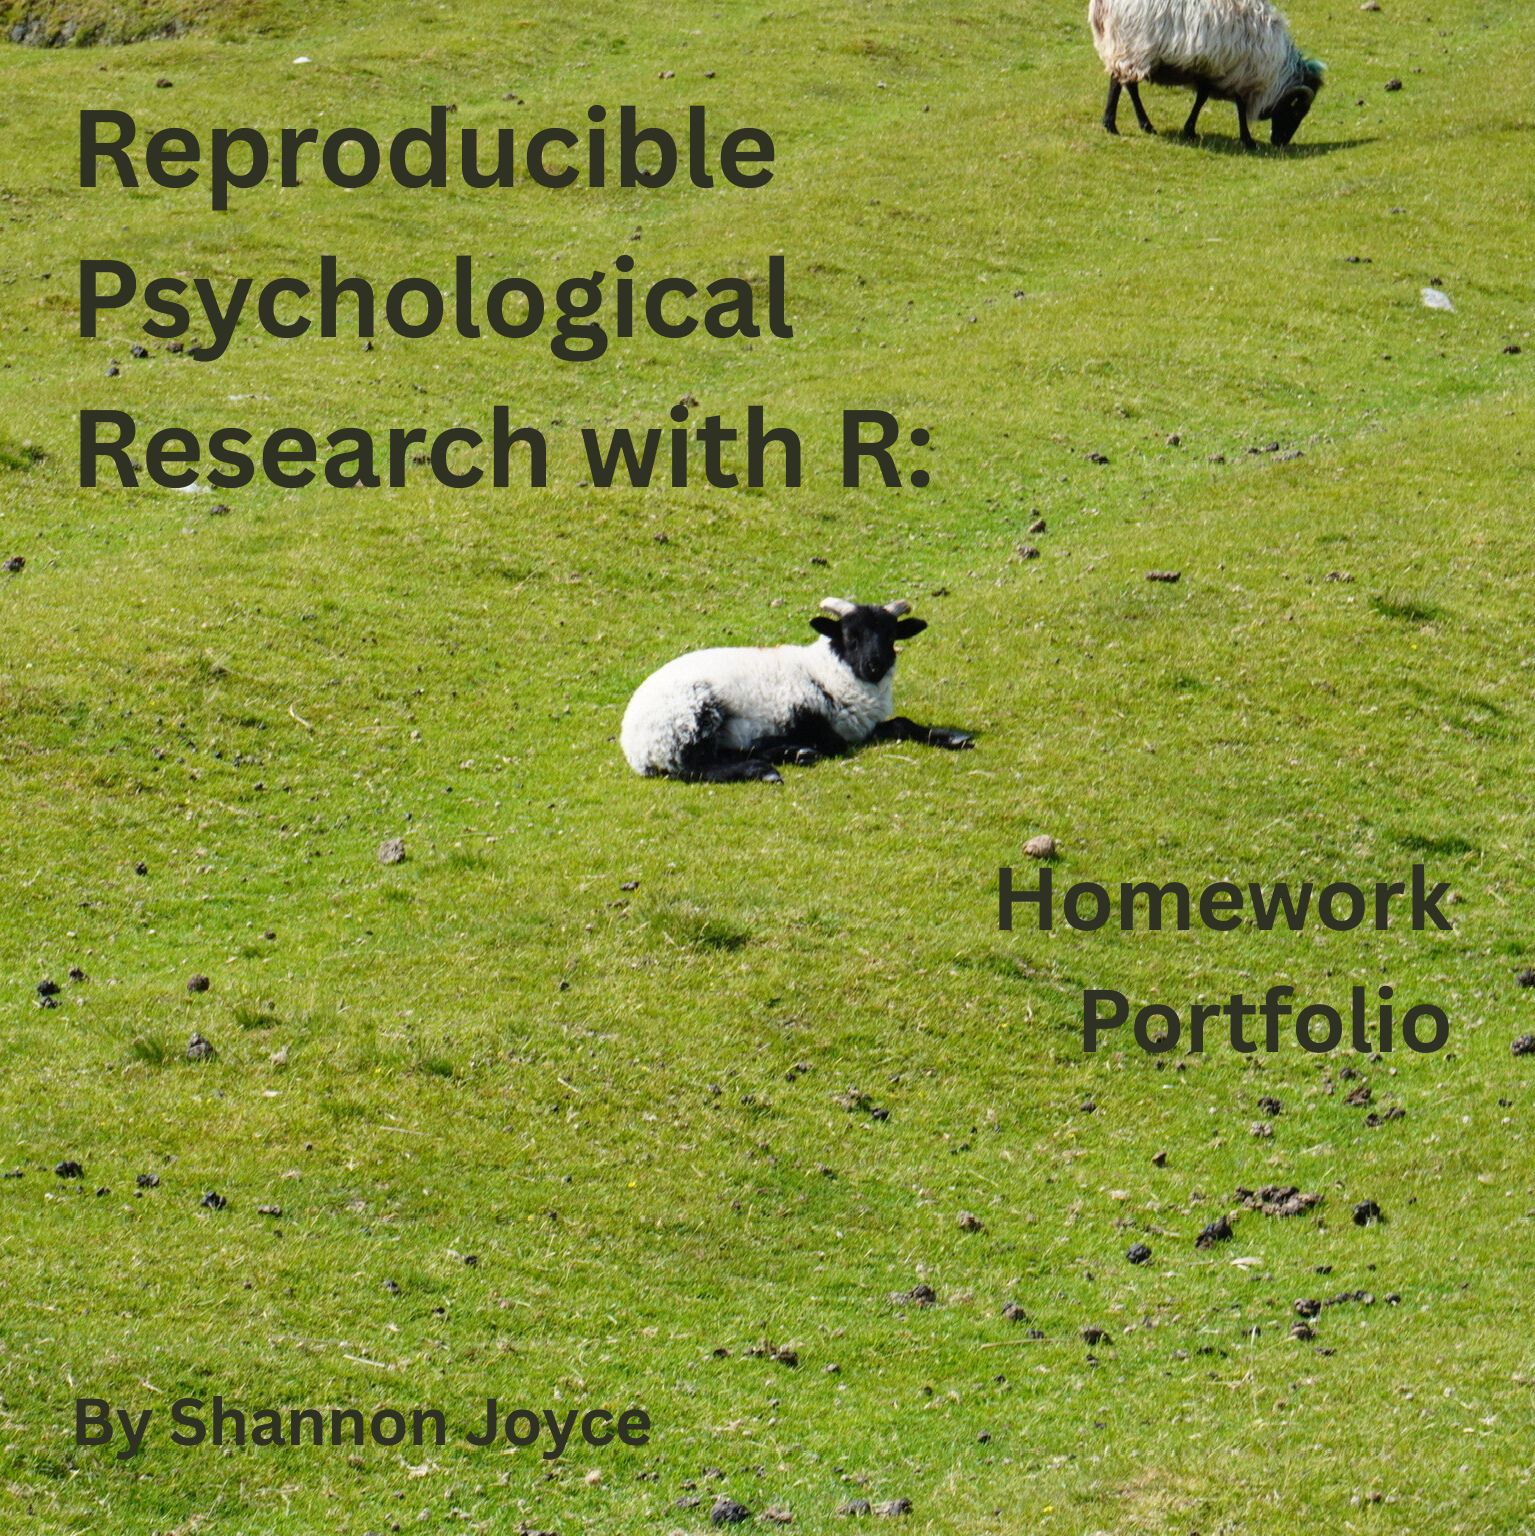
This is a compilation of all homework assignments that I have completed for my graduate class on Reproducible Psychological Research. In these assignments, I have successfully written and executed R scripts for data analysis, cleaned and wrangled datasets using reproducible workflows, created publication-quality figures using ggplot2, conducted and interpreted common statistical tests, communicated results through reproducible R Markdown documents, and applied open science … Read more →
Introduction to Environmental Data Science
by Jerry Davis, SFSU Institute for Geographic Information Science
Background, methods and exercises for using R for environmental data science. The focus is on applying the R language and various libraries for data abstraction, transformation, data analysis, spatial data/mapping, statistical modeling, and time series, applied to environmental research. Applies exploratory data analysis methods and tidyverse approaches in R, and includes contributed chapters presenting research applications, with associated data and code packages. Read more →
A Guide on Data Analysis
by Mike Nguyen
This is a guide on how to conduct data analysis in the field of data science, statistics, or machine learning. […] The intended audience includes those with little to no experience in statistics, econometrics, or data science, as well as individuals with a budding interest in these fields who are eager to deepen their knowledge. While my primary domain of interest is marketing, the principles and methods discussed in this book are universally applicable to any discipline that employs scientific methods or data analysis. I hope this book provides a valuable starting point for aspiring … Read more →
Intro to Econometrics
by Michael Kevane and William Sundstrom
This book is an introductory textbook for courses in basic quantitative data analysis. The emphasis is on regression analysis, where the analyst seeks to estimate the parameters that describe a causal relationship. An example is used consistently throughout the book: the relationship between educational attainment and adult wages later in life. The book introduces the student to R and RStudio, statistical computing software that is commonly used in academic, government, civil society, and corporate settings. R is an open source programming language and software environment for statistical computing and graphics. The R computing environment provides the data management, data wrangling, analysis, and visualization tools needed for virtually all analysis. The book is appropriate for students in Economics, Development Studies, Political Science, and Sociology. Read more →
Data Analysis with R
by Joseph Fox
Data Analysis with R […] R is an open-source programming language that is popular among statisticians and data scientists. We’ll be using the software RStudio to write and run R code. There are two ways to access RStudio for free. You can choose either of the following options. Download R and RStudio to your own computer. Visit https://posit.co/download/rstudio-desktop/ and click both download buttons to start the two required installations. Access Posit Cloud (formerly RStudio Cloud) online. Visit https://posit.cloud/ and click “Get Started,” then choose the free plan on the next page. … Read more →
Financial Data Science
by Prof. Dr. Ryan Riordan & Teaching Assistants
This bookdown contains the teaching materials for the projectcourse Financial Data Science at the LMU Munich. The files have been set u by Lisa Kaminski. [...] Here you will find the course pages for the projectcourse Financial Data Science. The course is offered regularly in the summer term and aims at providing in-depth knowledge about the programming language Python and its most important libraries for data analysis. We are a new institute at LMU Munich School of Management and conduct academically rigorous, relevant and exciting research and teaching in the domain of financial ... Read more →
Analysing Data using Linear Models
by Stéphanie M. van den Berg
This is the data analysis textbook used for study programmes at the faculty of BMS at the University of Twente. […] This book is for bachelor students in social, behavioural and management sciences that want to learn how to analyse their data, with the specific aim to answer research questions. The book has a practical take on data analysis: how to do it, how to interpret the results, and how to report the results. All techniques are presented within the framework of linear models: this includes simple and multiple regression models, linear mixed models and generalised linear models. This … Read more →
A Little R Survival Kit: Essential Data Analysis using R
by Eric S. Ho
A little book of R that supports readers who have scant programming experience to get a quick start of statistical analysis using R. […] In the 21st century, nobody does statistics by pen and paper. Those statistical tables found at the back of statistics textbooks belong in the museum. Statistics you hear from the news and research are produced by computers. This book uses R. You may ask why not using a spreadsheet, such as Microsoft Excel or Google Sheets. While they are excellent tools - easy to use, they have significant shortcomings. In particular, they lack of reproducibility, as they … Read more →
Introduction to R and Basic Data Analysis for Actuarial Science
by federicagazzelloni
Actuarial Faculty Development Program 2025 - ACTEX Learning […] This course is designed to equip participants with a structured approach to learn essential R skills required for actuarial exams This course equips participants with practical skills for using R in actuarial science. It focuses on the technical competencies needed for actuarial exams that incorporate data analysis and modeling, such as Predictive Analytics and Statistics for Risk Modeling (SRM). The session emphasizes hands-on, exam-relevant techniques that can be integrated into academic curricula or review programs. … Read more →
Introduction to R and Basic Data Analysis
by federicagazzelloni
Actuarial Faculty Development Program 2024 - ACTEX Learning […] This course is designed to introduce actuarial students to the R programming language This course is designed to equip you with the technical skills to use R in actuarial science. You’ll gain the necessary knowledge to succeed in the rapidly evolving world of risk analysis, insurance, and finance. Throughout the program, you’ll discover the power of R, one of the most widely-used programming languages in statistics and actuarial science, for performing essential tasks like pricing, reserving, and risk management. Whether you’re … Read more →
From Questions to Knowledge: Data Analysis for Psychology and Behavioural Science using R
by Daniel Nettle
An introduction to data analysis for psychology and behavioural science using R. This book introduces R programming, and covers a full range of statistical techniques likely to be useful to the researcher: General Linear Models, Linear Mixed Models, Generalized Linear Models, ANOVA, equivalence testing, meta-analysis, specification curve analysis, power analysis, and more. It also discusses principles of good study design, analysis strategy, pre-registration, and open science. No prior knowledge is required. Read more →
Exploring Complex Survey Data Analysis Using R
by Stephanie A. Zimmer, Rebecca J. Powell, and Isabella C. Velásquez
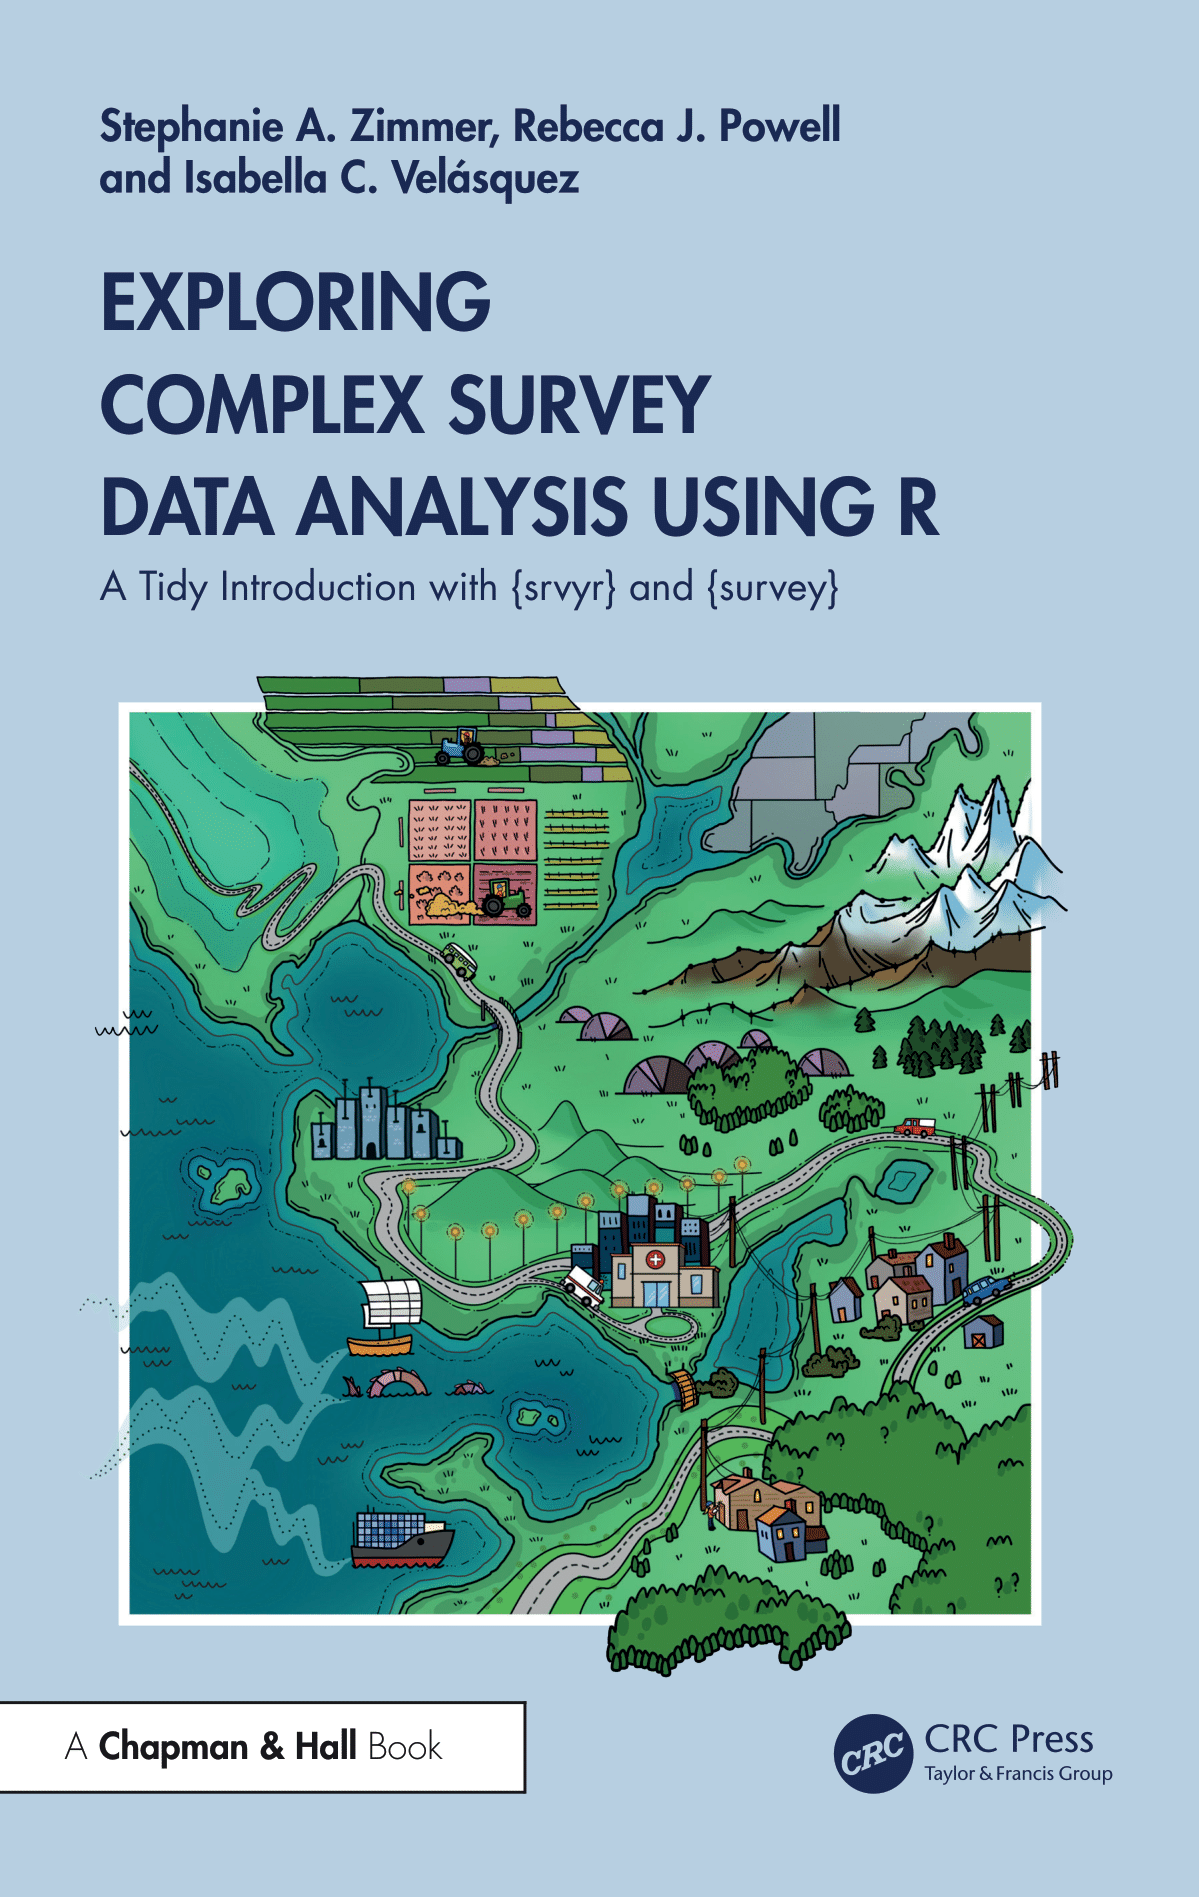
This is the online version of the book published by CRC Press in November 2024. You can purchase a copy of this book directly from Routledge or your preferred bookstore. The cover artwork was designed and created by Allison Horst. To Will, Tom, and Drew, thanks for all the help with additional chores and plenty of Git consulting! To cite this book, we recommend the following citation: Zimmer, S. A., Powell, R. J., & Velásquez, I. C. (2024). Exploring Complex Survey Data Analysis Using R: A Tidy Introduction with {srvyr} and {survey}. Chapman & Hall: CRC … Read more →
Data Analysis in R
by Author: Stefan Leach Contact: s.leach1@lancaster.ac.uk
This is a bookdown created by Dr Stefan Leach to help students and collaborators navigate statistical analyses in R. […] Welcome to this BookDown website Data Analysis in R designed to help you develop your knowledge of how to conduct statistical analysis, create figures, and troubleshoot in R. The book is broken into four chapters: 1. About 2. Foundations of data analysis with R 3. Importing, saving, and exploring data 4. Inferential … Read more →
Data Science for Psychologists
by S. Mason Garrison
Data Science for Psychologists: A Refreshed Exploratory and Graphical Data Analysis in R […] Welcome to class! This website accompanies Mason Garrison’s Data Science for Psychologists (DS4P), a quantitative methods course at Wake Forest University. DS4P is designed for curious beginners. No prior experience with R, coding, or quantitative methods is assumed—just a willingness to explore data in a hands-on way. I encourage anyone who is quant-curious to work their way through these course notes. The course notes include lectures, worked examples, readings, activities, and labs. You can find … Read more →
Doing Bayesian Data Analysis in brms and the tidyverse
by A. Solomon Kurz
A. Solomon Kurz Kruschke began his text with “This book explains how to actually do Bayesian data analysis, by real people (like you), for realistic data (like yours).” In the same way, this project is designed to help those real people do Bayesian data analysis. My contribution is converting Kruschke’s JAGS and Stan code for use in Bürkner’s brms package (Bürkner, 2017, 2018, 2022), which makes it easier to fit Bayesian regression models in R (R Core Team, 2022) using Hamiltonian Monte Carlo. I also prefer plotting and data wrangling with the packages from the tidyverse (Wickham et al., … Read more →
R数据分析入门
by Lingxiao HE
This is a textbook for a quick start on data analysis in R. […] R下载链接:点击任意站点,进入后,选择下载与操作系统匹配的R软件。 RStudio下载链接 练习题链接 打开RStudio,我们通常会看到如上图所示的界面。 界面1为脚本界面,我们将在这里写代码。如果这个界面没有出现,可以点击左上角2按键,选择R Script(快捷键为Ctrl+Shift+n)创建。在脚本界面中,如果我们想要运行特定一行的代码,可以把光标放在该行代码的任意位置,然后按右侧的Run3按键(快捷键为Ctrl+Enter)。如果要运行多行代码,则需要先用鼠标选中所有要运行的代码,然后再按Run按键。 界面4为控制台界面,代码运行的结果或者提示信息将会在这里显示。如果想运行单行指 … Read more →
CMC5105 - 수학교육통계분석: 회귀모형과 경시적 자료분석
by 최영근
최영근 CMC5105 - 수학교육통계분석: 회귀모형과 경시적 자료분석 (Statistical Analysis for Mathematics Educaiton: Regression Models and Longitudinal Data Analysis) 2024-2학기 성균관대 교과교육학과(수학) 대학원 월 6:00p–8:40p / 호암관 4층 … Read more →
Introduction to Bio-Medical data analysis with R
by Nhan Thi Ho MD, PhD
A series of hands-on practical guides to analysis of bio-medical data using R. […] This book includes a series of hands-on practical introductory guides to analysis of bio-medical data using R. It will provide learners with applied statistical knowledge, practical data analysis skill, basic statistical programming skill in R. The knowledge and skills from this series are also useful and applicable for those who use other statistical software. Data analysis is an essential part of bio-medical research. R is a free open source statistical analysis software which has been extensively used for … Read more →
Fundamental statistical concepts and techniques in the biological and environmental sciences: With jamovi
by A. Bradley Duthie
This is an introductory statistics textbook for students in the biological and environmental sciences with examples using jamovi statistical software. […] This online book is licensed under the Creative Commons Attribution-NonCommercial-ShareAlike 4.0 International License (CC BY-NC-SA 4.0). A print version published by CRC Press can be purchased from Routledge or Amazon. A free audiobook is available here. Nearly all research in the biological and environmental sciences relies on data analysis of some kind. Statistical literacy is therefore important, not just for doing research, but also for … Read more →
R for Non-Programmers: A Guide for Social Scientists
by Daniel Dauber
Are you interested in learning R, but intimidated by programming and statistical analysis? ‘R for Non-Programmers: A Guide for Social Scientists’ is the perfect resource for you. This book provides practical and efficient solutions to common challenges in empirical research in the Social Sciences, without assuming any prior knowledge or skills in programming or statistical analysis. Each chapter is dedicated to a specific task required to answer research questions and includes exercises and case studies based on real data. Whether you are a novice or experienced analyst, this book is a comprehensive entry to R programming that will help enhance your data analysis skills. Read more →
Linear Algebra
by Bakti Siregar, M.Sc., CDS
Linear Algebra is a branch of mathematics that plays a fundamental role in various fields, ranging from physics and engineering to economics and computer science. In recent decades, the advancements in technology and data science have further emphasized the importance of Linear Algebra, particularly in finance, business, and machine learning. This book is designed to bridge the understanding of the basic theories of Linear Algebra with its applications in modern contexts, where data analysis and decision optimization are increasingly essential for strategic decision-making. In the world of … Read more →
Data Analysis and Visualization for Communication Science
by morleyjamesweston
Data Analysis and Visualization for Communication Science […] This class will be the intersection of data analysis, visual design, and communication science. We’ll examine some good and bad data visualizations, and make plenty of our own. No prior knowledge of R will be required to take this course, but students should be prepared to learn a new programming language and to work with data. Short answer: Sure! Just don’t trust them. With a university email address, you can sign up for the GitHub Student Developer Pack, which will let you use the GitHub Copilot AI tool for free. UZH also … Read more →
STAT 521B: Topics in Multivariate Analysis
by Alexander Sharp
Course notes. […] This notebook comprises the notes for the course “Theory of Functional Data Analysis with Applications” taught during the Winter 2024 semester, term 2, at UBC. They follow closely the textbook (Hsing and Eubank … Read more →
Regression Models
by Maria Durban
Regression Models […] These notes contain both the theory and practice for the statistical models presented in the course. Regression Analysis is the most common statistical modeling approach used in data analysis, and it is the basis for more advanced statistical and machine learning modeling. In this course, you will received the foundation knowledge in the use of widely used tools in regression analysis. You will learn the basics of regression analysis such as linear regression, logistic regression, Poisson regression, generalized linear regression and generalized additive models. … Read more →
Psychometrics in Exercises using R and RStudio
by Anna Brown
This textbook provides a comprehensive set of exercises for practicing all major Psychometric techniques using R and RStudio. Each exercise includes a worked example illustrating data analysis steps and teaching how to interpret results and make analysis decisions, and self-test questions that readers can attempt to check own understanding. […] This textbook provides a comprehensive set of exercises for practicing all major Psychometric techniques using R and RStudio. The exercises are based on real data from research studies and operational assessments, and provide step-by-step guides that … Read more →
Introduction to Statistics and Data Analysis – A Case-Based Approach
by Conrad Ziller, University of Duisburg-Essen
A book created with bookdown. […] Suggested citation: Ziller, Conrad (2024). Introduction to Statistics and Data Analysis – A Case-Based Approach. Available online at https://bookdown.org/conradziller/introstatistics To download the R-Scripts and data used in this book, go HERE. A PDF-version of the book can be downloaded HERE. This short book is a complete introduction to statistics and data analysis using R and RStudio. It contains hands-on exercises with real data—mostly from social sciences. In addition, this book presents four key ingredients of statistical data analysis (univariate … Read more →
Data Analysis in Medicine and Health using R
by Kamarul Imran, Wan Nor Arifin, Tengku Muhammad Hanis Tengku Mokhtar
Data Analysis in Medicine and Health using R […] We wrote this book to help new R programming users with limited programming and statistical background. We understand the struggles they are going through to move from point-and-click statistical software such as SPSS or MS Excel to more code-centric software such as R and Python. From our experiences, frustration sets in early in learning this code-centric software. It often demotivates new users to the extent that they ditch them and return to using point-and-click statistical software. This book will minimize these struggles and gently … Read more →
Landscape Genetic Data Analysis with R
by Editor: Helene Wagner (University of Toronto)
This is a web-interface to the teaching materials for the lab course ‘Landscape Genetic Data Analysis with R’ associated with the distributed graduate course ‘DGS Landscape Genetics’. The output format is bookdown::gitbook. […] This is a web-interface to the teaching materials for the lab course ‘Landscape Genetic Data Analysis with R’ associated with the distributed graduate course ‘DGS Landscape Genetics’. The Landscape Genetics Distributed Graduate Seminar (DGS) is an international collaboration that provides a unique opportunity for interdisciplinary graduate training. The course draws … Read more →
Meta-Workflow
by Miao YU
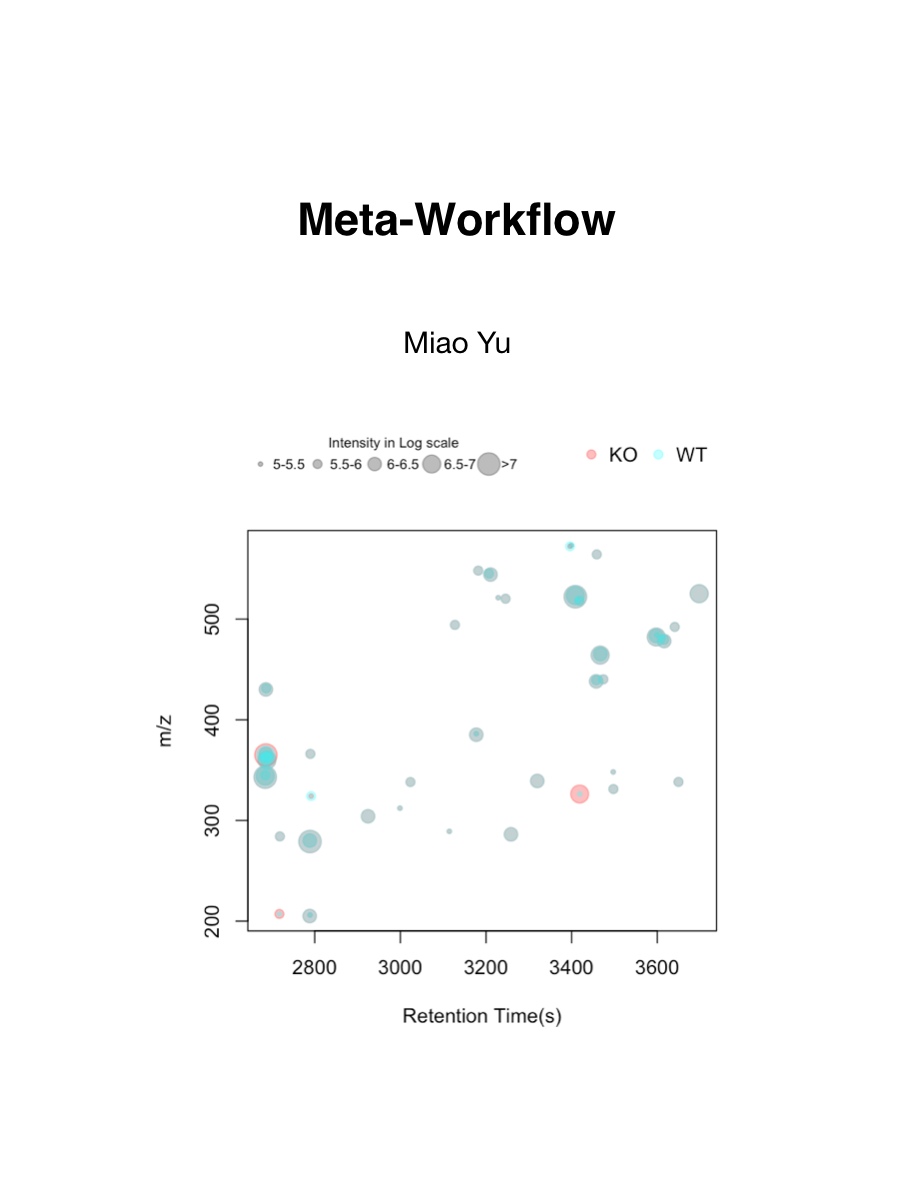
This is a workflow for metabolomics studies. […] This is an online handout for mass spectrometry based metabolomics data analysis. It would cover a full reproducible metabolomics workflow for data analysis and important topics related to metabolomics. Here is a list of topics: This is a book written in Bookdown. You could contribute it by a pull request in Github. A workshop based on this book could be found here. Meanwhile, a docker image xcmsrocker is available for metabolomics reproducible research. R and Rstudio are the software needed in this … Read more →
Inferential Reasoning in Data Analysis
by Ben Prytherch
Ben Prytherch People who analyze data are usually interested in something other than the data they analyze. A financial analyst might use patterns and anomalies in market data to create an investment strategy for the upcoming year. A physician might reference data from a randomized controlled trial when deciding what drug to prescribe to a patient. A basketball coach might plan player rotations after looking at data collected from their next opponent’s recent matches. Members of a local board of education might look at data from state standardized tests to decide whether to approve a proposed … Read more →
Meta-analysis Shiny Application Guideline
by Sangyoung Jung
Sangyoung Jung This application can help data analysis for the meta analysis and data visualization including forest plots and geographical frequency maps. It offers four key benefits: Data Cleaning and Check: The application not only cleanses datasets, preparing elements such as author names for meta-analysis, but also assists in identifying missing values and outliers during data checks. Meta-analysis Model Fitting: It is capable of conducting meta-analysis and moderator analysis with detailed statistics and diagnostic plots. Data Visualization: The application supports data visualization, … Read more →
Insights and Analyses: A Course Companion
by Tyler R. Pritchard
Tyler R. Pritchard Report errors, recommendations, or concerns to trpritchard@grenfell.mun.ca. Latest Updates: Jan 2024 Dec 2023 From the university calendar: PSYC 3950 Research Methods and Data Analysis in Psychology III will cover advanced research methods, including survey methods, and supporting statistical concepts and techniques. Designs will include single factor designs and multi-factor designs with both random and fixed factors. Supporting statistical concepts will include analysis of variance (ANOVA) from a linear model perspective, statistical power, and multiple regression, … Read more →
R Markdown: The Definitive Guide
by Yihui Xie, J. J. Allaire, Garrett Grolemund
The first official book authored by the core R Markdown developers that provides a comprehensive and accurate reference to the R Markdown ecosystem. With R Markdown, you can easily create reproducible data analysis reports, presentations, dashboards, interactive applications, books, dissertations, websites, and journal articles, while enjoying the simplicity of Markdown and the great power of R and other languages. Read more →
An Introduction to R Analytics
by GT CY
This is a blueprint of an introduction to R. […] Welcome to the world of data analysis! “Introduction to R in Data Analytics” is your friendly guide to understanding how to use the R programming language for playing with data. If you’re new to this, don’t worry - we’ve got you covered. This book takes you step by step, teaching you how to make sense of data using R. We’ll show you how to organize information, create cool charts and graphs, and even predict trends from data. You’ll learn all about the powerful tools that R offers for understanding numbers and patterns in data. But we won’t … Read more →
Analysing CRISPR Screens with edgeR
by Göknur Giner
This is a book version to write a book. set in the _output.yml file. The HTML output format for this example is bookdown::gitbook, [...] Welcome to the “Analyzing CRISPR Screens with edgeR”. Our aim is to empower researchers like you with the tools and knowledge needed to navigate the complex landscape of CRISPR data analysis. This platform serves as the central hub for a comprehensive guide on leveraging one of the most commonly used differential expression analysis Bioconductor package edgeR, for the analysis of CRISPR screens. Whether you’re delving into CRISPR experiments for the ... Read more →
Foundations of Statistics
by Prof Peter Neal and Dr Daniel Cavey
Lecture Notes for Foundations of Statistics […] In this course the fundamental principles and techniques underlying modern statistical and data analysis will be introduced. The course will cover the core foundations of statistical theory consisting of: The course highlights the importance of computers, and in particular, statistical packages, in performing modern statistical analysis. Students will be introduced to the statistical package R as a statistical and programming tool and will gain experience in interpreting and communicating its output. Learning Outcomes A student who completes … Read more →
STAT 331
by Ben Prytherch
Ben Prytherch STAT 331, as the title states, is an “applied” statistics course. It is intended for anyone who has taken at least one introductory level statistics course, and who wants to learn more about the use of statistical methods in quantitative research. It covers many statistical tools that are usually considered too advanced for an introductory level class, but are nonetheless very popular. It also provides guidance on making data analysis decisions. Most assignments will involve looking up a published scientific paper for which the data are available and reproducing the main … Read more →
Spatial transcriptomics data analysis: theory and practice
by Eleftherios Zormpas, Dr Simon J. Cockell
This book will guide you through the practical steps of the in-person tutorial IP2 for the ISMB/ECCB 2023 conference in Lyon named: Spatial transcriptomics data analysis: theory and practice. […] This book will guide you through the practical steps of the in-person tutorial IP2 for the ISMB/ECCB 2023 conference in Lyon named: “Spatial transcriptomics data analysis: theory and practice”. Recent technological advances have led to the application of RNA Sequencing in situ. This allows for whole-transcriptome characterisation, at approaching single-cell resolution, while retaining the spatial … Read more →
Workshop: Interactive Data Analysis with Shiny
by Paul C. Bauer & Jonas Lieth
Paul C. Bauer & Jonas Lieth This document serves as slides and script for the workshop Interactive Data Analysis with Shiny taught by Paul C. Bauer and Jonas Lieth (Gesis, Mannheim, Online, 5-7th of July 2023). Original material is licensed under a Attribution-NonCommercial-ShareAlike 4.0 International (CC BY-NC-SA 4.0) license. Where we draw on other authors material other licenses may apply (see references in the syllabus as well as the citations and links in the script). For potential future versions of this material see the github repository. If you have feedback or discover errors/dead … Read more →
Applied longitudinal data analysis in brms and the tidyverse
by A Solomon Kurz
This project is a reworking of Singer and Willett’s classic (2003) text within a contemporary Bayesian framework with emphasis of the brms and tidyverse packages within the R computational framework. […] This project is based on Singer and Willett’s classic (2003) text, Applied longitudinal data analysis: Modeling change and event occurrence. You can download the data used in the text at http://www.bristol.ac.uk/cmm/learning/support/singer-willett.html and find a wealth of ideas on how to fit the models in the text at https://stats.idre.ucla.edu/other/examples/alda/. My contributions show … Read more →
Generalized Linear Mixture Model
by Ying Lu and Marc Scott
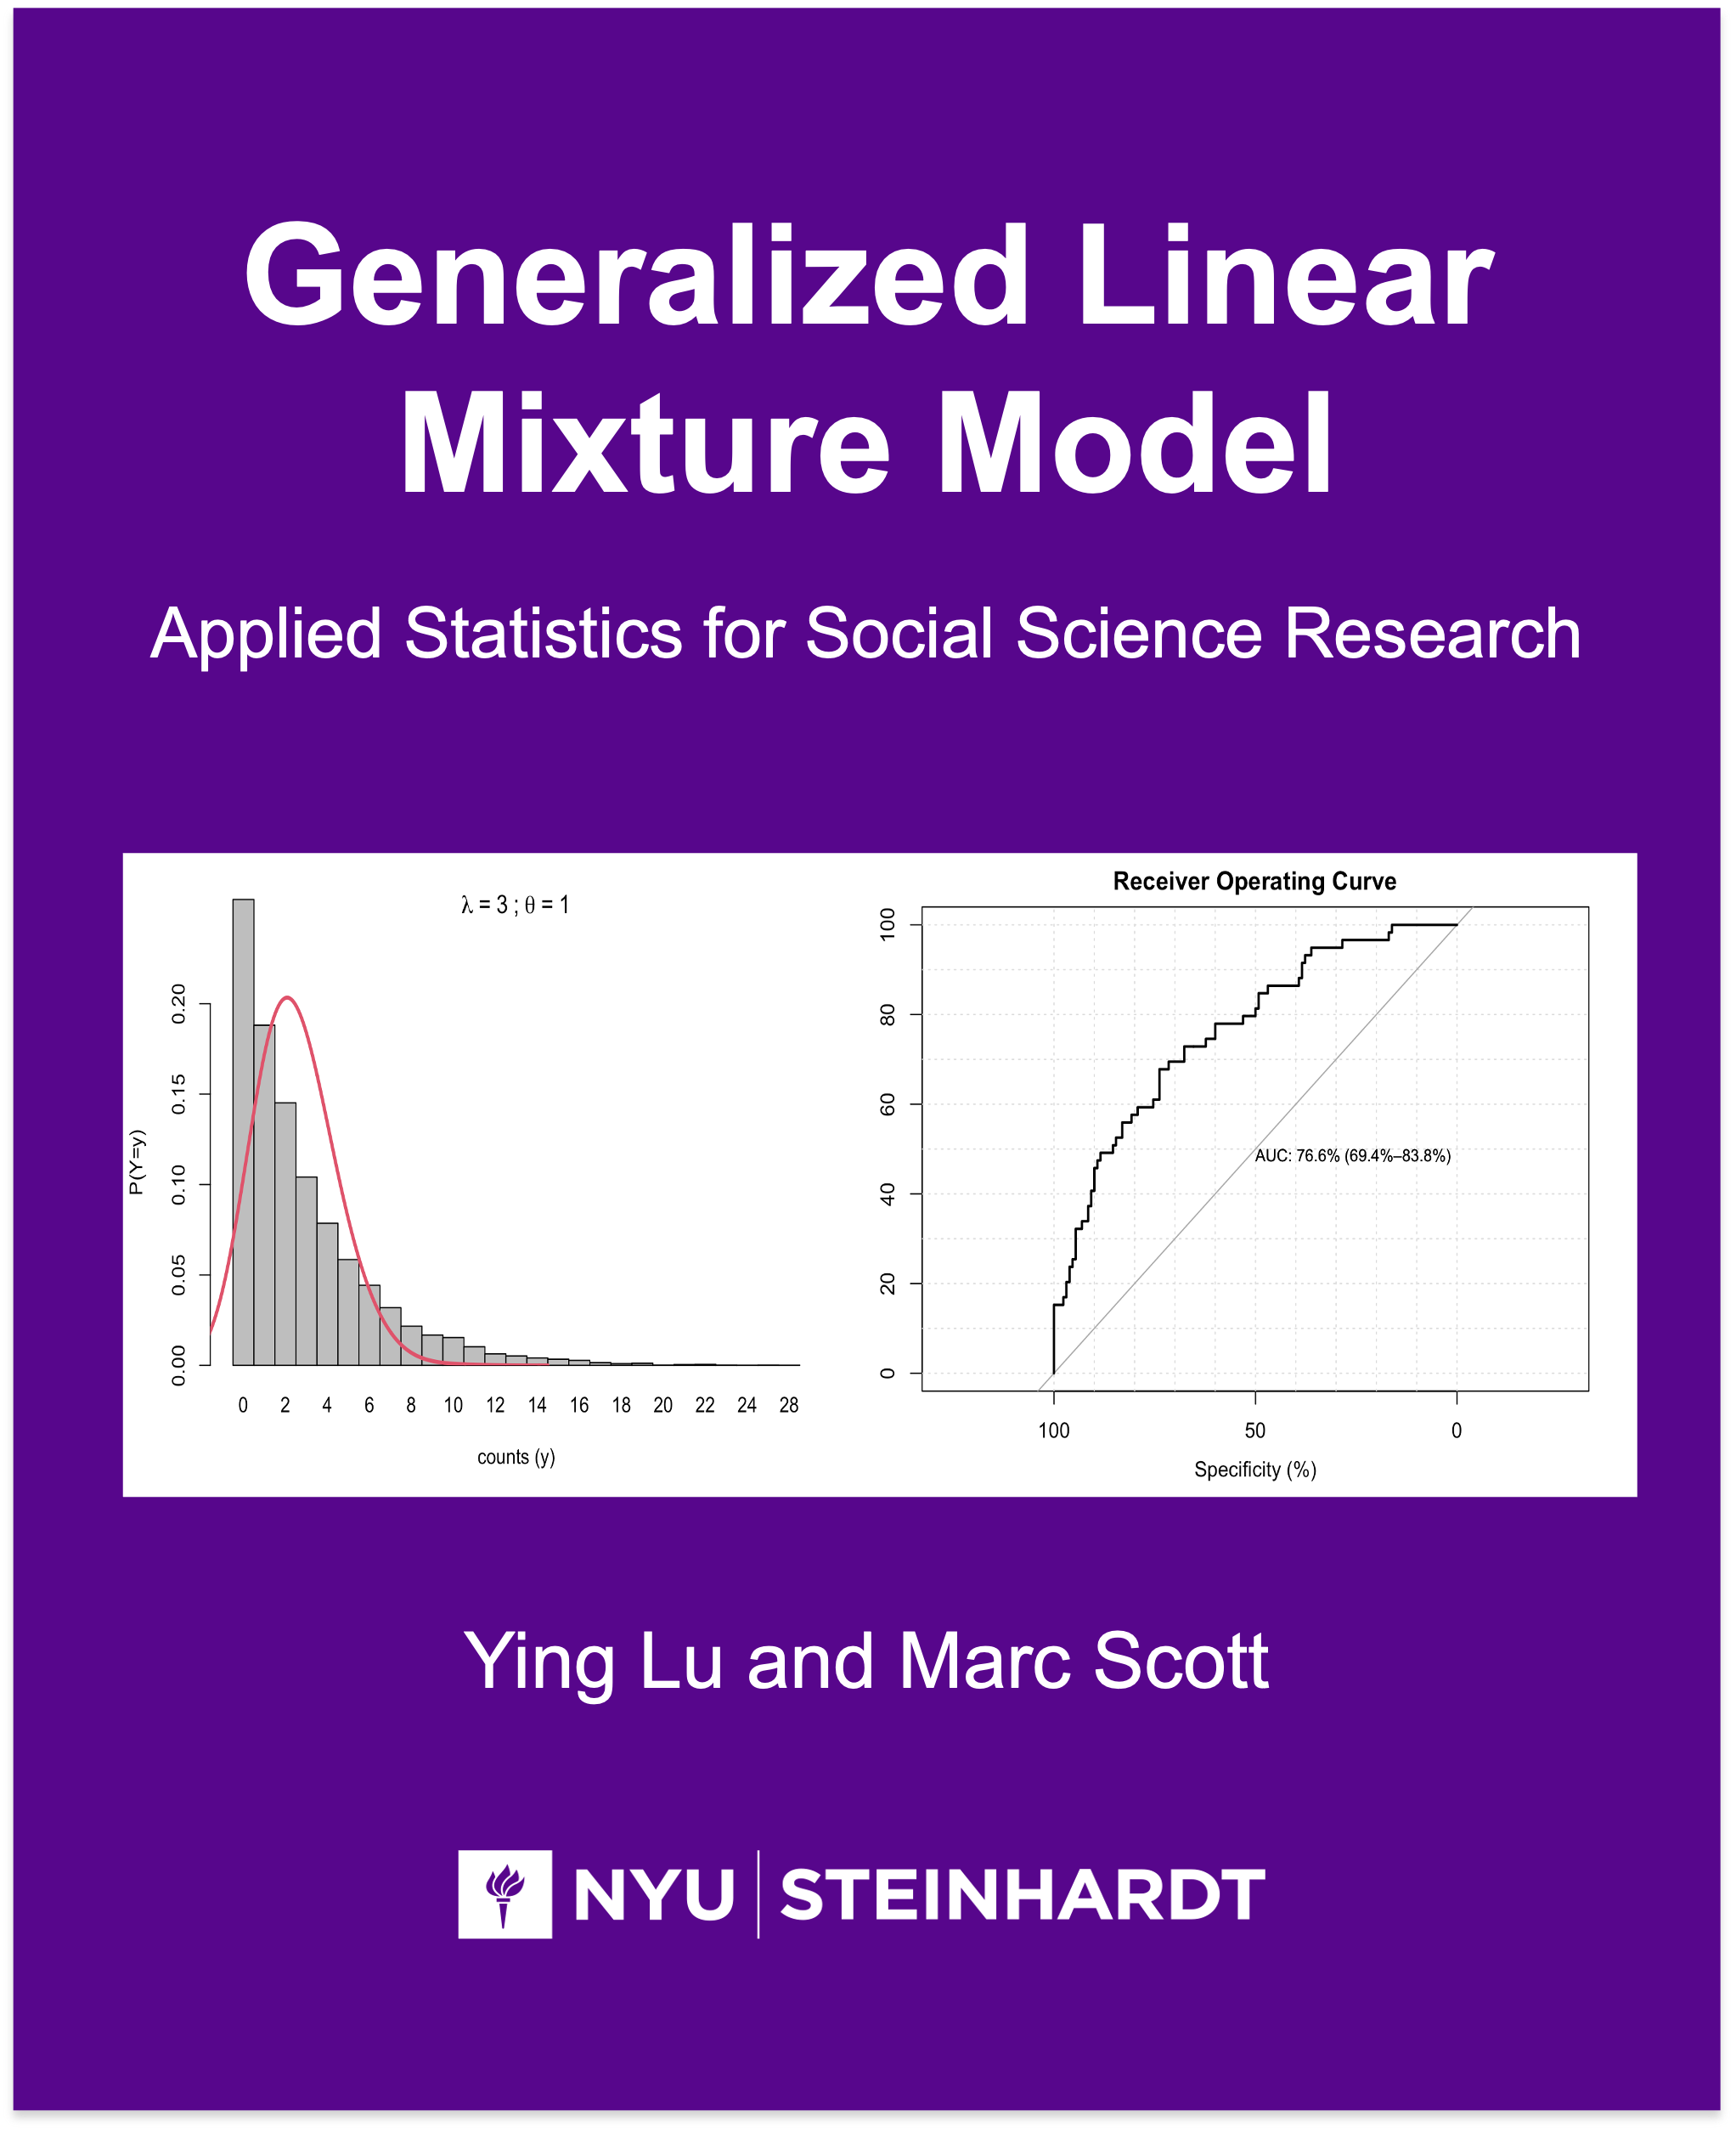
This is a minimal example of using the bookdown package to write a book. set in the _output.yml file. The HTML output format for this example is bookdown::gitbook, [...] This is a course in advanced statistical techniques that covers generalized linear models and extensions that are commonly used in health and policy research. Assuming a strong foundation in the general linear model (linear regression and ANOVA) and exposure to the linear mixed model (a.k.a. multilevel models), this course focuses on data analysis that utilizes models for categorical, discrete or limited outcomes, some ... Read more →
DSCI 335: Inferential Reasoning in Data Analysis
by Ben Prytherch
DSCI 335: Inferential Reasoning in Data Analysis […] This book is meant to accompany DSCI 335. It is not a complete textbook; you will need to take notes on what you hear in class and what you read throughout the semester. In it, you will find: This book will likely be updated and revised as the semester progresses. Feel free to read ahead, just don’t be surprised if something … Read more →
Financial Data Science
by Prof. Dr. Ryan Riordan & Teaching Assistants
This bookdown contains the teaching materials for the projectcourse Financial Data Science at the LMU Munich. The files have been set up by Lisa Kaminski. [...] Here you will find the course pages for the projectcourse Financial Data Science. The course is offered regularly in the summer term and aims at providing in-depth knowledge about the programming language Python and its most important libraries for data analysis. Furthermore, the course introduces the topic of database management and the process of retrieving, aggregating and manipulating data using SQL. Students will learn to ... Read more →
tidy[ing] up POL345
by John Kim
A guide to the tidyverse for POL345 Students. […] POL345 is often Princeton students’ first foray into the programming language R. Through POL345, students gain an introductory overview of R, and programming generally, to conduct basic data analysis on their own. However, many further courses (SML201, SOC306, POL346), along with industry users of R, use the tidyverse instead, a “language” within R to conduct clean, readable data analysis. This book seeks to bridge that gap, revisiting each of the POL345 handouts using the tidyverse to introduce students to this “language within a language”. … Read more →
Programming and Applied Data Visualization with R
by Dr. Paul C. Bauer (University of Mannheim)
Q: What is your experience with looking at data analysis code you have written 2 years earlier? Comment your code Use meaningful names! A “new” package dplyr written by Hadley Wickham/Romain Francois replaces many old functions for data management Functions in dplyr are highly performant (big data!) and consistent See this page for an excellent overview and the Data Wrangling Cheat Sheet What could the following functions be used for? Hadley Wickhams ggplot2 Package developed into a powerful alternative to the default plot() function. Its goal is to simplify complex plots (e.g. take care of … Read more →
An Introduction to ggplot2
by Ozancan Ozdemir
A ggplot2 Tutorial […] Hi! Data Visualization is one of the important steps of the data analysis process. It is actually not only part of the data analysis, but also can be considered as an art. R Programming language provides a powerful visualization package to us, ggplot2. This book aims to show how you can make a well-known statistical plots by using ggplot2, and also how you can improve or customize them. The book is created by the lab notes of statistical computing (STAT 291-STAT 292) of Ozancan Ozdemir. For your opinions and suggestions, please send me an e-mail to … Read more →
Elon R Data Camp
by Adam Aiken

These notes cover our three hours together as we learn about using R for data analysis with R Studio. […] What is R and why are you here? We are to spend our time tonight learning about R, R Markdown, and the developer environment that puts these tools together, R Studio. How do these tools fit together? Scriptability, coding, working with our data (\rightarrow) R Reproducible, literate programming with all of our code, narrative, and formatted output in one place (\rightarrow) R Markdown A place to do this (\rightarrow) RStudio Our most important goal: Get R and RStudio running on … Read more →
Data Analysis
by Chia-Ching Wu
A book created with bookdown. […] R語言是一個開源(open-source)的程式語言,是用來做資料探勘、統計分析與繪圖的工具。R語言是1990年代初期,奧克蘭大學統計學教授Ross Ihaka與Robert Gentleman共同開發的,在歷經了近三十年的演變後,現在由R核心團隊成員共同維護。 除了R語言之外,常見的統計分析軟體還包括了SPSS、SAS、Stata、Minitab等,甚至Microsoft office裡的Excel試算表也都可以用來做簡單的統計分析和繪圖。那麼,究竟在這麼多軟體下,R語言有什麼優勢,讓很多人選擇它呢? R語言最大的優勢在於,它是跨平台的免費軟體,而且擁有豐富的資源。 … Read more →
Data Analysis in R
by Steve Midway
This is a text that covers the principles and practices of handling and analyzing data. … Read more →
An Introduction to Bayesian Reasoning and Methods
by Kevin Ross
This textbook presents an introduction to Bayesian reasoning and methods […] Statistics is the science of learning from data. Statistics involves We will assume some familiarity with many of these aspects, and we will focus on the items in italics. That is, we will focus on statistical inference, the process of using data analysis to draw conclusions about a population or process beyond the existing data. “Traditional” hypothesis tests and confidence intervals that you are familiar with are components of “frequestist” statistics. This book will introduce aspects of “Bayesian” statistics. We … Read more →
Bridging the gap between service extension and cultural facilitation among ASHAs
by Oskar Burger, Maciej J. Danko, Faiz Hashmi, Palash Singh, Hannah Lunkenheimer, Emily Little, Micah Goldwater, Tracy Johnson, Cristine Legare
This book covers data analysis and synthesis for the major empirical contributions of Project RISE. Project RISE is a mixed-methods project designed to leverage the power of ritual for understanding the motivation and performance of community health workers in Bihar. […] Project RISE is a collaborative and mixed-methods effort with the goal of improving maternal and newborn health in Bihar, India by designing tools to help the motivation and performance of community health workers. This Report covers data analysis and synthesis for the major empirical sections of Project RISE, including … Read more →
Portfolio, Churn & Customer Value
by Hugo Cornet, Pierre-Emmanuel Diot, Guillaume Le Halper, Djawed Mancer
This research paper aims at modelling customer portfolio, churn and customer value. […] This paper is being realized as part of our last year in master’s degree in economics. It aims at studying a firm’s most valuable asset namely its customers. To that end, we adopt a quantitative approach based on econometrics and data analysis with a threefold purpose to : After having defined the subject’s key concepts, we apply duration models and machine learning techniques to a kaggle dataset related to customers of a fictional telecommunications service provider (TSP). Keywords: customer portfolio … Read more →
Single Cell Multi-Omics Data Analysis
by Yuting Liu
This book is a collection for pre-processing and visualizing scripts for single cell milti-omics data. The data is downsampled from a real dataset. … Read more →
Using R in Social Work Research
by Jerry Bean, College of Social Work, The Ohio State University
This is an example of using the bookdown package to write a book. The output format for this example is bookdown::gitbook. […] Our goal for this document is to illustrate the importance of good data analysis practices and how R and companion packages support these practices. We think the R system has many benefits for social work research. R has become the flagship computing environment for many areas of science and has great appeal because it is free and open-access. In addition, free tools like RStudio and R Markdown promote an a replication commitment and open science philosophy … Read more →
R @ Ewha (Sunbok Lee)
by Sunbok Lee copied by 212AIE40 Jiwon Choi
R @ Ewha (Sunbok Lee) […] “In nonrandomized experiments, it is usually only possible to detemine the existence of a relationship between two measurements, but not the underlying mechanism or the reason for it.” It is known that the best way to investigate causal relationship is to conduct randomized experiments. However, unlike in natural science, it is not easy to conduct randomized experiments in social science because of ethical and practical reasons. The fundamental dilemma of data analysis in social science is that we essentially want to make causal statements in the absence of … Read more →
R for Solving Social Problems
by Sunbok Lee (Ewha Womans University, 2021-2)
R for Solving Social Problems […] Before talking about R and social problems, let’s talk about the types of data analysis first. @leek2015question categorized data analysis into the 6 types as presented in the table below, and emphasized “mistaking the type of question being considered is the most common error in data analysis.” @leek2015question’s main point is that we should keep in mind the type of question being asked by our own data analysis. In other words, we should say what we can say, not what we want to say. @leek2015question presents a table showing common mistakes “In … Read more →
Using R for Educational Research
by Jerry Bean, College of Education and Human Ecology, The Ohio State University
This is an example of using the bookdown package to write a book […] Our goal for this document is to illustrate the importance of good data analysis practices and how R and companion packages support these practices. We think the R system has many benefits for educational research. R has become the flagship computing environment for many areas of science and has great appeal because it is free and open-access. In addition, free tools like RStudio and R Markdown promote a replication commitment and open science philosophy important to our work. One particular strength of R is that it … Read more →
The Shape of Polarization: A Topological Data Analysis of Congressional Voting Patterns
by Aidan Toner-Rodgers
The Shape of Polarization: A Topological Data Analysis of Congressional Voting Patterns […] Polarization is a pervasive feature of modern American politics. But has this always been the case? Understanding trends in polarization has been a topic of intense interest in the social sciences, with researchers taking a variety of approaches. The classic strategy has been to use congressional roll call votes and measure the difference in voting patterns between parties (Theriault, 2008; Ladewig, 2010; Shor, 2018; Moskowitz, 2019). More recent work has used text analysis of congressional speech … Read more →
Do A Data Science Project in 10 Days
by Gangmin Li
This is a data science project practice book. It was initially written for my Big Data course to help students to run a quick data analytical project and to understand 1. the data analytical process, the typical tasks and the methods, techniques and the algorithms need to accomplish these tasks. During convid19, the unicersity has adopted on-line teaching. So the students can not access to the university labs and HPC facilities. Gaining an experience of doing a data science project becomes individual students self-learning in isolation. This book aimed to help them to read through it and follow instructions to complete the sample propject by themslef. However, it is required by many other students who want to know about data analytics, machine learning and particularly practical issues, to gain experience and confidence of doing data analysis. So it is aimed for beginners and have no much knowledge of data Science. the format for this book is bookdown::gitbook. Read more →
Using R for Social Work Research
by Jerry Bean, College of Social Work, The Ohio State University
This is an example of using the bookdown package to write a book […] Our goal for this document is to illustrate the importance of good data analysis practices and how R and companion packages support these practices. We think the R system has many benefits for social work research. R has become the flagship computing environment for many areas of science and has great appeal because it is free and open-access. In addition, free tools like RStudio and R Markdown promote a replication commitment and open science philosophy important to our work. One particular strength of R is that it … Read more →
COVID Data Analysis
by Mike Lyons
Analysis of COVID Data from data.ct.gov. […] I am not an epidemiologist, nor am I a professional scientist or proper research professional. I studied Engineering in college quite a few years ago, and work in the cosmetics industry now. I am also a curious citizen and father who wanted to get sense for the prevalence of COVID where I live, in Redding, CT and the surrounding … Read more →
Computational Genomics with R
by Altuna Akalin
A guide to computationa genomics using R. The book covers fundemental topics with practical examples for an interdisciplinery audience […] The aim of this book is to provide the fundamentals for data analysis for genomics. We developed this book based on the computational genomics courses we are giving every year. We have had invariably an interdisciplinary audience with backgrounds from physics, biology, medicine, math, computer science or other quantitative fields. We want this book to be a starting point for computational genomics students and a guide for further data analysis in more … Read more →
R for Fundamental Data Analysis in Market Research
by Sujata Ramnarayan
Everything you need (and nothing more) to begin to learn R for fundamental data analysis in Market Research […] … Read more →
DondeRs Group
by Henrik Eckermann
This bookdown-project contains introductory material to learn the R programming language […] Instructor: My name is Henrik. I am a PhD-candidate in the Developmental Psychobiology lab group at the Donders Institute in Nijmegen. I find that the R programming language is an extremely useful tool for Scientists, especially (but not only) for data analysis and visualization. I can help you learning the basics of the R programming language and how to approach learning a programming language so you can advance in learning whatever is needed in your specific field. Target audience: Anyone at … Read more →
Causal Inference in Education
by Anthony Schmidt
Causal Inference in Education […] It is an R-based book of data analysis exercises related to the following three causal inference … Read more →
Doing Bayesian Data Analysis in brms and the tidyverse
by A Solomon Kurz
This project is an attempt to re-express the code in Kruschke’s (2014) textbook. His models are re-fit in brms, plots are redone with ggplot2, and the general data wrangling code predominantly follows the tidyverse style. […] Kruschke began his text with “This book explains how to actually do Bayesian data analysis, by real people (like you), for realistic data (like yours).” In the same way, this project is designed to help those real people do Bayesian data analysis. My contribution is converting Kruschke’s JAGS code for use in Bürkner’s brms package, which makes it easier to fit Bayesian … Read more →
The Open Quant Live Book
by OpenQuants.com
The Open Quant Live Book […] The book aims to be an Open Source introductory reference of the most important aspects of financial data analysis, algo trading, portfolio selection, econophysics and machine learning in finance with an emphasis in reproducibility and openness not to be found in most other typical Wall Street-like references. The Book is Open and we welcome co-authors. Feel free to reach out or simply create a pull request with your contribution! See project structure, guidelines and how to contribute here. First published at: openquants.com. Licensed under Attribution-NonCommer … Read more →
Course Handouts for Bayesian Data Analysis Class
by Mark Lai
This is a collection of my course handouts for PSYC 621 class in the 2019 Spring semester. Please contact me [mailto:hokchiol@usc.edu] for any errors (as I’m sure there are plenty of them). […] This is a collection of my course handouts for PSYC 621 class. The materials are based on the book by McElreath (2016), the brms package (Bürkner 2017), and the STAN language. Please contact me for any errors (as I’m sure there are plenty of them). Bürkner, Paul-Christian. 2017. “brms: An R Package for Bayesian Multilevel Models Using Stan.” Journal of Statistical Software 80 (1): 1–28. … Read more →
Teaching and Learning with Jupyter
by Lorena A. Barba, Lecia J. Barker, Douglas S. Blank, Jed Brown, Allen B. Downey, Timothy George, Lindsey J. Heagy, Kyle T. Mandli, Jason K. Moore, David Lippert, Kyle E. Niemeyer, Ryan R. Watkins, Richard H. West, Elizabeth Wickes, Carol Willing, and Michael Zingale
A handbook on teaching and learning with Jupyter notebooks. […] Lorena A. Barba, Lecia J. Barker, Douglas S. Blank, Jed Brown, Allen B. Downey, Timothy George, Lindsey J. Heagy, Kyle T. Mandli, Jason K. Moore, David Lippert, Kyle E. Niemeyer, Ryan R. Watkins, Richard H. West, Elizabeth Wickes, Carol Willing, and Michael Zingale This handbook is for any educator teaching a topic that includes data analysis or computation in order to support learning. It is not just for educators teaching courses in engineering or science, but also data journalism, business and quantitative economics, data-based … Read more →
Data Analysis for Psychology in R (dapR1) - Labs
by Department of Psychology, University of Edinburgh
This is the page that contains the course labs materials […] Data Analysis for Psychology in R 1 (dapR1) is your first step on the road to being a data, programming and applied statistics guru! This course provides a introduction to data, R and statistics. It is designed to work slowly through conceptual content that form the basis of understanding and working with data to perform statistical testing. At the same time, we will be introducing you to basic programming in R, covering the fundamentals of working with data, visualization and simple statistical tests. The overall aim of the … Read more →
Readings in applied data science
by Qiushi Yan
Readings in applied data science […] This project is highly motivated and inspired by stats337 at Stanford University offered by Hadley Wickham, and Data Science with R: A Resource Compendium by Martin Monkman. They both provided great reading materials in data analysis with R, or applied data science in general. Here I attempt to finish one or two papers per week, draw a brief summary, and document my personal … Read more →
Uber Movement dataset : playing with spatial data
by Clement Lefevre
Using the Uber Movement dataset, we combine it with the OpenStreetMap data for Berlin. […] Uber released for some cities the datasets of their drivers movement. Those include the OSM way identifier, the mean and standard speed deviation. In order to anonymize them, the data have been aggregated per hour. Let’s have a look at the Berlin data for the month of June 2019, and how they are distributed in space and time. For this, we will combine those data with the OpenStreetMap shapefile for Berlin. Through this book, we will use some concepts of data analysis … Read more →
How to Build a Shiny Application from Scratch
by Hadrien@rstudio.com
How to Build a Shiny Application from Scratch […] Shiny is a powerful R package which allows you to create interactive web applications using the R programming language. It is particularly useful for creating applications that run on data and include some sort of data analysis or visualization. In addition to leveraging the power of R and its thousands of packages, one of the big benefits of shiny is the ease of developing applications using R only. Although it is possible to incorporate more traditional web design languages such as custom CSS or Javascript into your shiny application, it … Read more →
Introduction to Data Exploration and Analysis with R
by Michael Mahoney
A detailed introduction to coding in R and the process of data analytics. Version 1.0.0 […] Welcome to Introduction to Data Exploration and Analysis in R (IDEAr)! This book is designed as a crash course in coding with R and data analysis, built for people trying to teach themselves the skills needed for most analyst jobs today. You won’t need any past experience with R or data analytics - the aim of the book is to work as a primer for people of all backgrounds. This book is currently being continuously deployed to bookdown.org and GitHub while editing continues. This is so that I can get … Read more →
Data Analysis and Processing with R based on IBIS data
by Kevin Donovan
Data Analysis and Processing with R based on IBIS data […] Over the course of my time working with the Carolina Insitute for Developmental Disabilities (CIDD) and the Infant Brain Imaging Study (IBIS) network, I have seen a great interest in learning how to do basic statistical analyses and data processing among the trainees. Specially, there is an interest in learning how to use R, due to its popularity across the sciences and its zero financial cost. As a statistican in training, I feel it is a great benefit for scientists to learn R. It is vital for scientists to understand the … Read more →
Techincal Analysis with R
by Ko Chiu Yu
This is an introductory textbook that focuses on how to use R to do technical analysis. […] R is widely used in statistical computation. It is well-suited to do computationally heavy financial analysis. In particular, evaluating performance of trading rule based on technical indicators. Moreover, R can be one-stop solution to the whole procedure of data analysis. A standard procedure of financial data analysis is: You can do all of them inside R without using other software. This short book is a short introduction on how to use R and RStudio to do financial data analysis from the beginning. … Read more →
Big data and Social Science
by Paul C. Bauer
Script for the seminar ‘Big Data and Social Science’ at the University of Bern. […] The present document serves both as slides and script for the workshop/seminar Big Data and Social Science. This seminar is taught by Paul C. Bauer at the University of Bern (Fall Semester 2018). The material was developed by Paul C. Bauer and heavily draws on material developed by Pablo Barberà in courses such as Social Media & Big Data Research, Big Data Analysis in the Social Sciences and Automated Collection of Web and Social Data. Any original material and examples is licensed under a Creative Commons … Read more →
Notes for ST463/ST683 Linear Models 1
by Katarina Domijan, Catherine Hurley
These are the notes for ST463/ST683 Linear Models 1 course offered by the Mathematics and Statistics Department at Maynooth University. This module is offered at as a part of of MSc in Data Science and Data Analytics. It is an introductory course for students who have basic background in Statistics, Data analysis, R Programming and linear algebra (matrices). […] There are many good resources, e.g. Weisberg (2005), Fox (2005), Fox (2016), Ramsey and Schafer (2002), Draper and Smith (1966). We will use Minitab and R (R Core Team 2017). To create this document, I am using the bookdown package … Read more →
Course Notes for IS 6489, Statistics and Predictive Analytics
by Jeff Webb
Course notes for IS 6489. […] These are the course notes for IS 6489, Statistics and Predictive Analytics, offered through the Information Systems (IS) department in the University of Utah’s David Eccles School of Business. This is an exciting time for data analysis! The field has undergone a revolution in the last 15 years with increases in computing power and the availability of “big data” from web-based systems of data collection. “Data science” is the umbrella term that describes the result of this revolution—a new discipline at the intersection of many traditional fields such as … Read more →
An Introduction to Quantitative Text Analysis for Linguistics
by Jerid Francom
Book The goal of this textbook is to provide readers with foundational knowledge and practical skills in quantitative text analysis using the R programming language. It is geared towards advanced undergraduates, graduate students, and researchers looking to expand their methodological toolbox. It assumes no prior knowledge of programming or quantitative methods and prioritizes practical application and intuitive understanding over technical details. By the end of this textbook, readers will be able to identify, interpret and evaluate data analysis procedures and results to support research … Read more →
Bayesian Basics
by Michael Clark m-clark.github.io

This document provides an introduction to Bayesian data analysis. It is conceptual in nature, but uses the probabilistic programming language Stan for demonstration (and its implementation in R via rstan). From elementary examples, guidance is provided for data preparation, efficient modeling, diagnostics, and more. […] Michael Clark m-clark.github.io … Read more →
Data Science Live Book
by Pablo Casas
An intuitive and practical approach to data analysis, data preparation and machine learning, suitable for all ages! […] This book is now available at Amazon. Check it out! 📗 🚀. Link to the black & white version, also available on full-color. It can be shipped to over 100 countries. 🌎 The book will facilitate the understanding of common issues when data analysis and machine learning are done. Building a predictive model is as difficult as one line of R code: That’s it. But, data has its dirtiness in practice. We need to sculp it, just like an artist does, to expose its information in order … Read more →
Introduction to Data Science
by Rafael A. Irizarry

This book introduces concepts and skills that can help you tackle real-world data analysis challenges. It covers concepts from probability, statistical inference, linear regression and machine learning and helps you develop skills such as R programming, data wrangling with dplyr, data visualization with ggplot2, file organization with UNIX/Linux shell, version control with GitHub, and reproducible document preparation with R markdown. Read more →
Modern Data Visualization with R
by Robert Kabacoff
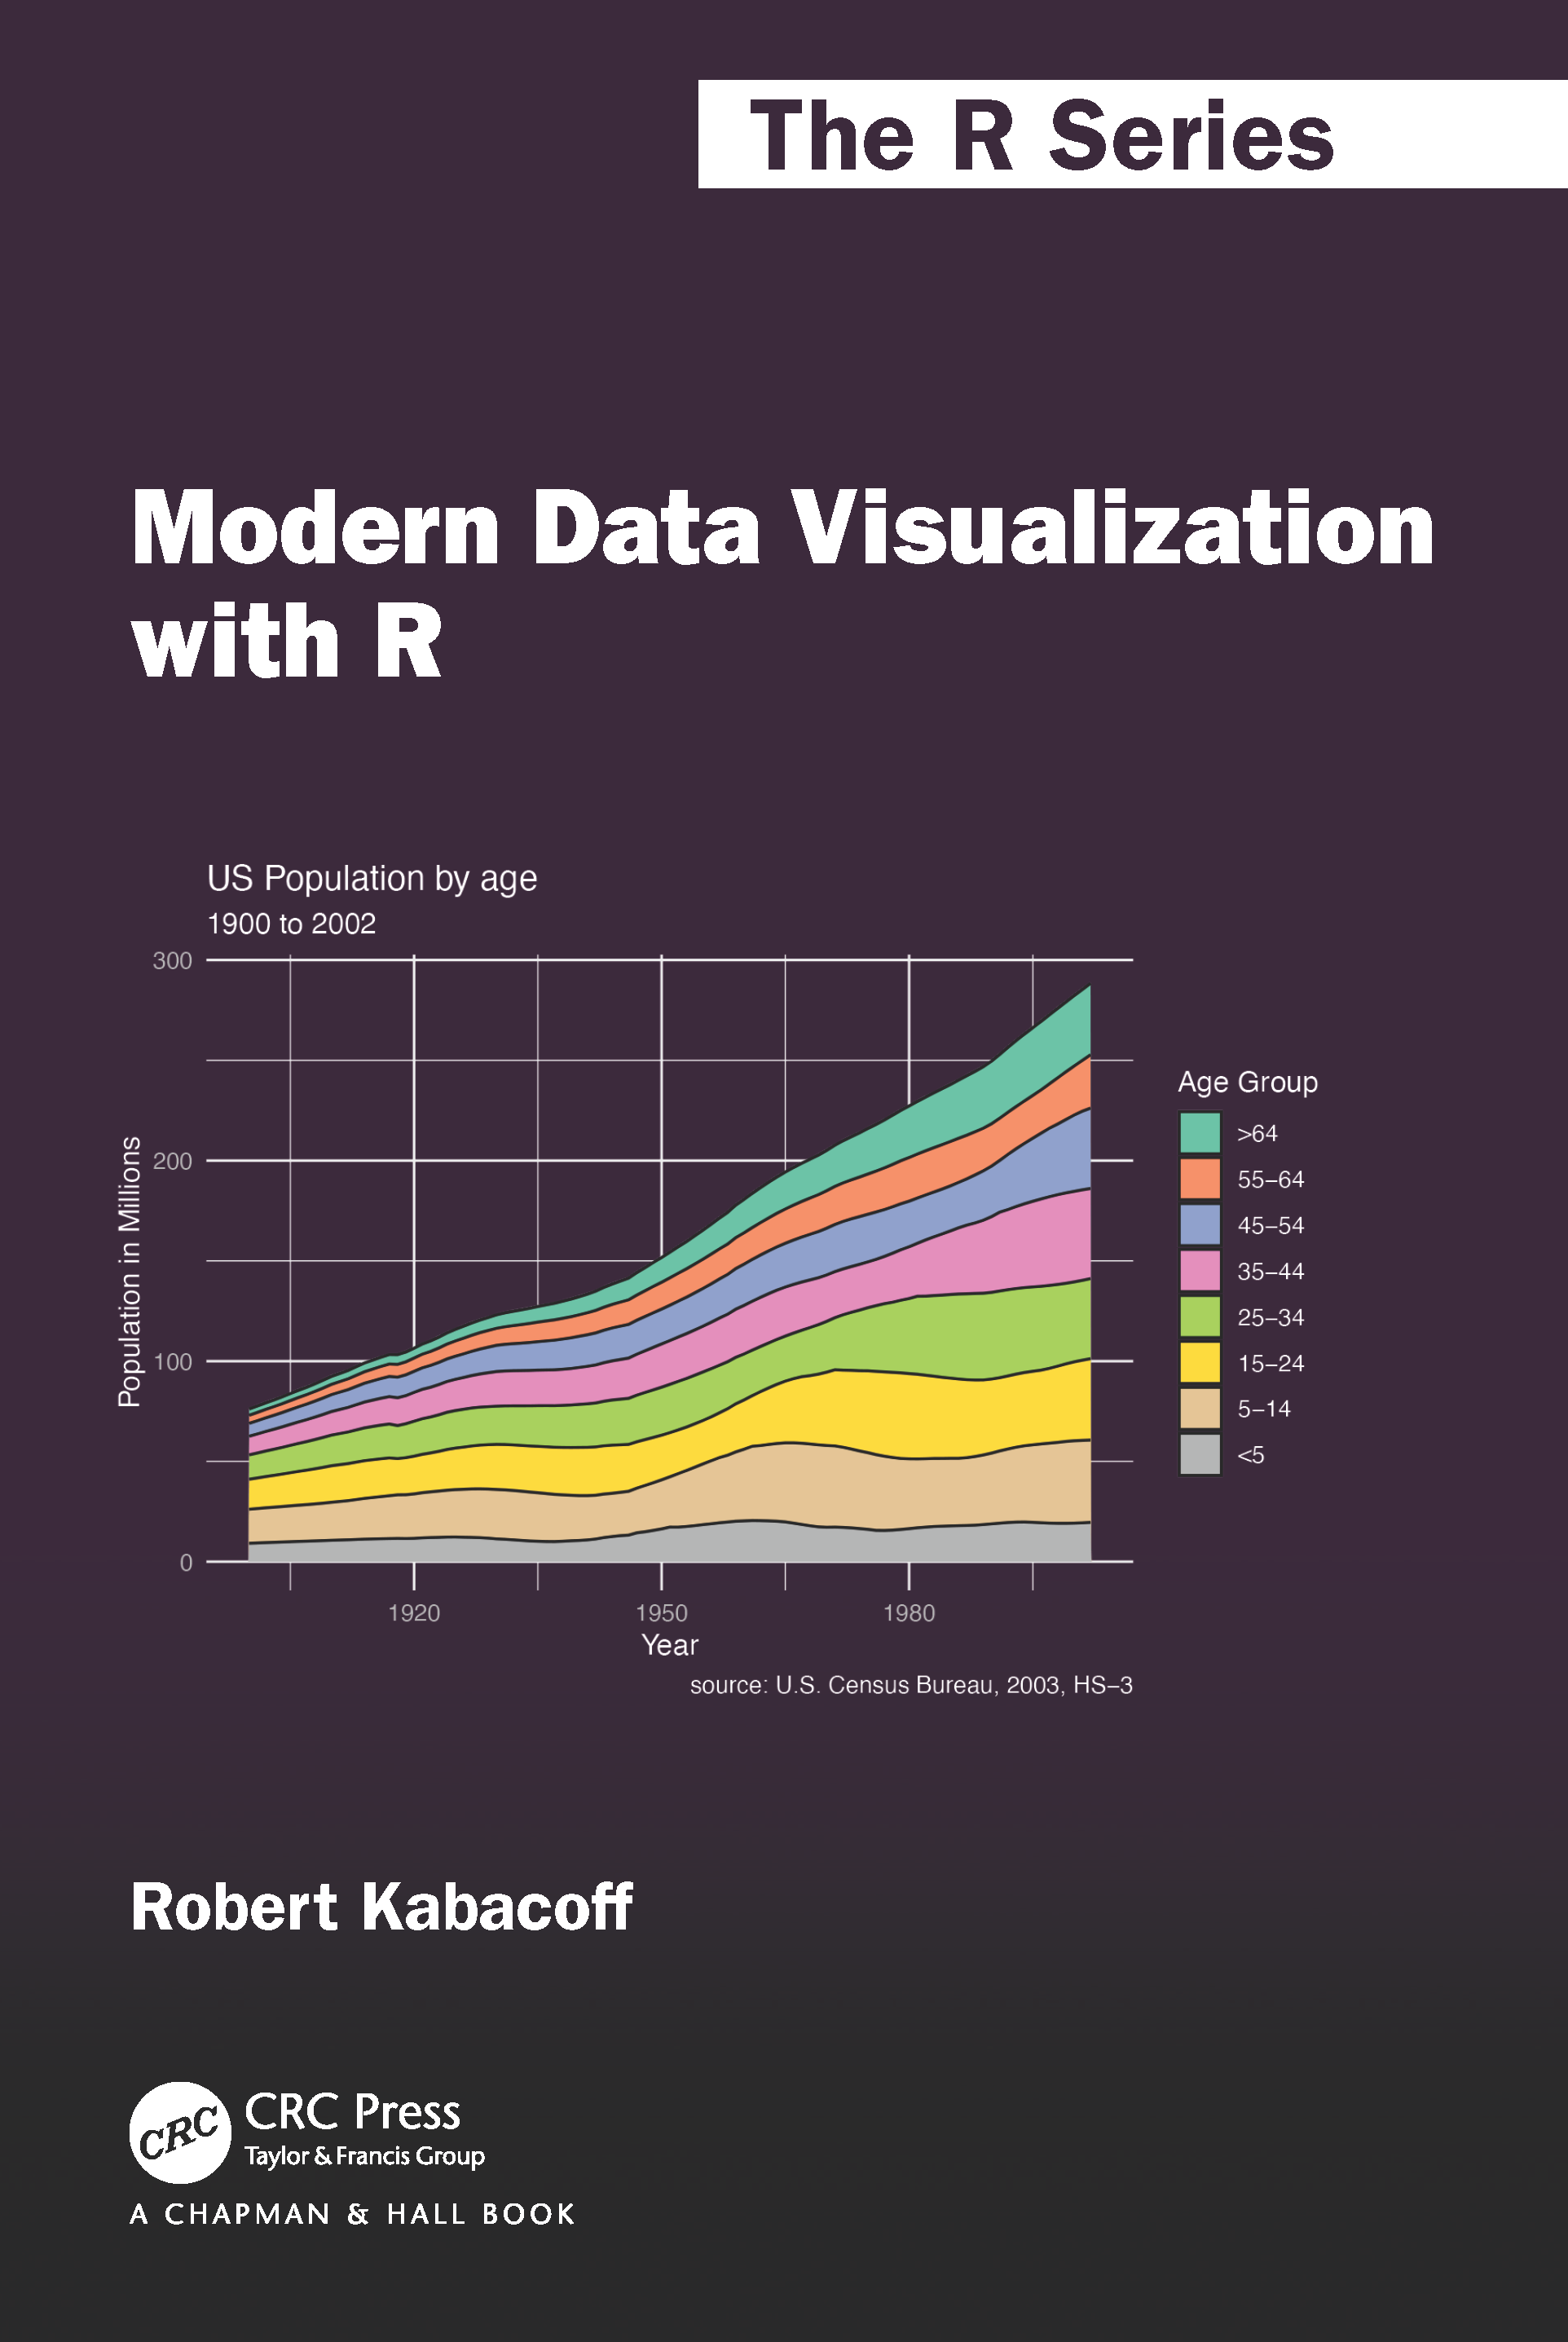
This is an illustrated guide for creating data visualizations in R. […] This is the online version of “Modern Data Visualization with R”, published by CRC Press. A print version is also available from Amazon. R is an amazing platform for data analysis, capable of creating almost any type of graph. This book helps you create the most popular visualizations - from quick and dirty plots to publication-ready graphs. The text relies heavily on the ggplot2 package for graphics, but other approaches are covered as well. My goal is make this book as helpful and user-friendly as possible. Any … Read more →
What They Forgot to Teach You About R
by Jennifer Bryan, Jim Hester, Shannon Pileggi, E. David Aja
Jennifer Bryan Jim Hester Shannon Pileggi E. David Aja This book is a work in progress. This book focuses on content intrinsically related to the infrastructure surrounding data analysis in R, but does not delve into the data analysis itself. A holistic workflow provides guidance on project-oriented workflows that address common sources of friction in data analysis. Personal R administration empowers R users to confidently manage their R programming environment. All is Fail showcases functions, options, and RStudio capabilities for debugging code, facilitating more efficient resolution of … Read more →