Visualization
R Class Analytics Portfolio
by Jonah Dratfield
This is a portfolio of R work I completed in my fall 2025 graduate reproducible psychology course. These assignments demonstrate my ability to use R to analyze different types of statistical information and to use R to create meaningful visualizations of this data. They also demonstrate my evolution as a programmer and analyst as I learned the program. […] Welcome! This is a portfolio of R work I completed in my fall 2025 graduate reproducible psychology course. These assignments demonstrate my ability to use R to analyze different types of statistical information and to use R to create … Read more →
Unlocking the Power of Data Visualization with R
by fede_gazzelloni
A full list of Data Visualizations with code made with the R programming language. Welcome to Unlocking the Power of Data Visualization with R! A collection of contributions to former #R4DS community, now DSLC.io through the #TidyTuesday, #30DayChartChallenge, #30DayMapChallenge taken every year in November, and the #DuBoisChallenge. This platform is a gateway to data exploration, featuring a diverse collection of data visualizations created using the R programming language. Take a deep dive into the digital gallery, click on the image to discover insights, find inspiration, and learn from … Read more →
Intro to Econometrics
by Michael Kevane and William Sundstrom
This book is an introductory textbook for courses in basic quantitative data analysis. The emphasis is on regression analysis, where the analyst seeks to estimate the parameters that describe a causal relationship. An example is used consistently throughout the book: the relationship between educational attainment and adult wages later in life. The book introduces the student to R and RStudio, statistical computing software that is commonly used in academic, government, civil society, and corporate settings. R is an open source programming language and software environment for statistical computing and graphics. The R computing environment provides the data management, data wrangling, analysis, and visualization tools needed for virtually all analysis. The book is appropriate for students in Economics, Development Studies, Political Science, and Sociology. Read more →
PHAR 520: Applied Omics Science for Drug Discovery and Development
by ggiaever
PHAR 520: Applied Omics Science for Drug Discovery and Development […] This module is based on the Data visualization chapter in Hadley Wickham’s book 2nd edition of ‘R 4 data science’(see … Read more →
Introduction to Econometrics with R
by Christoph Hanck, Martin Arnold, Alexander Gerber, and Martin Schmelzer
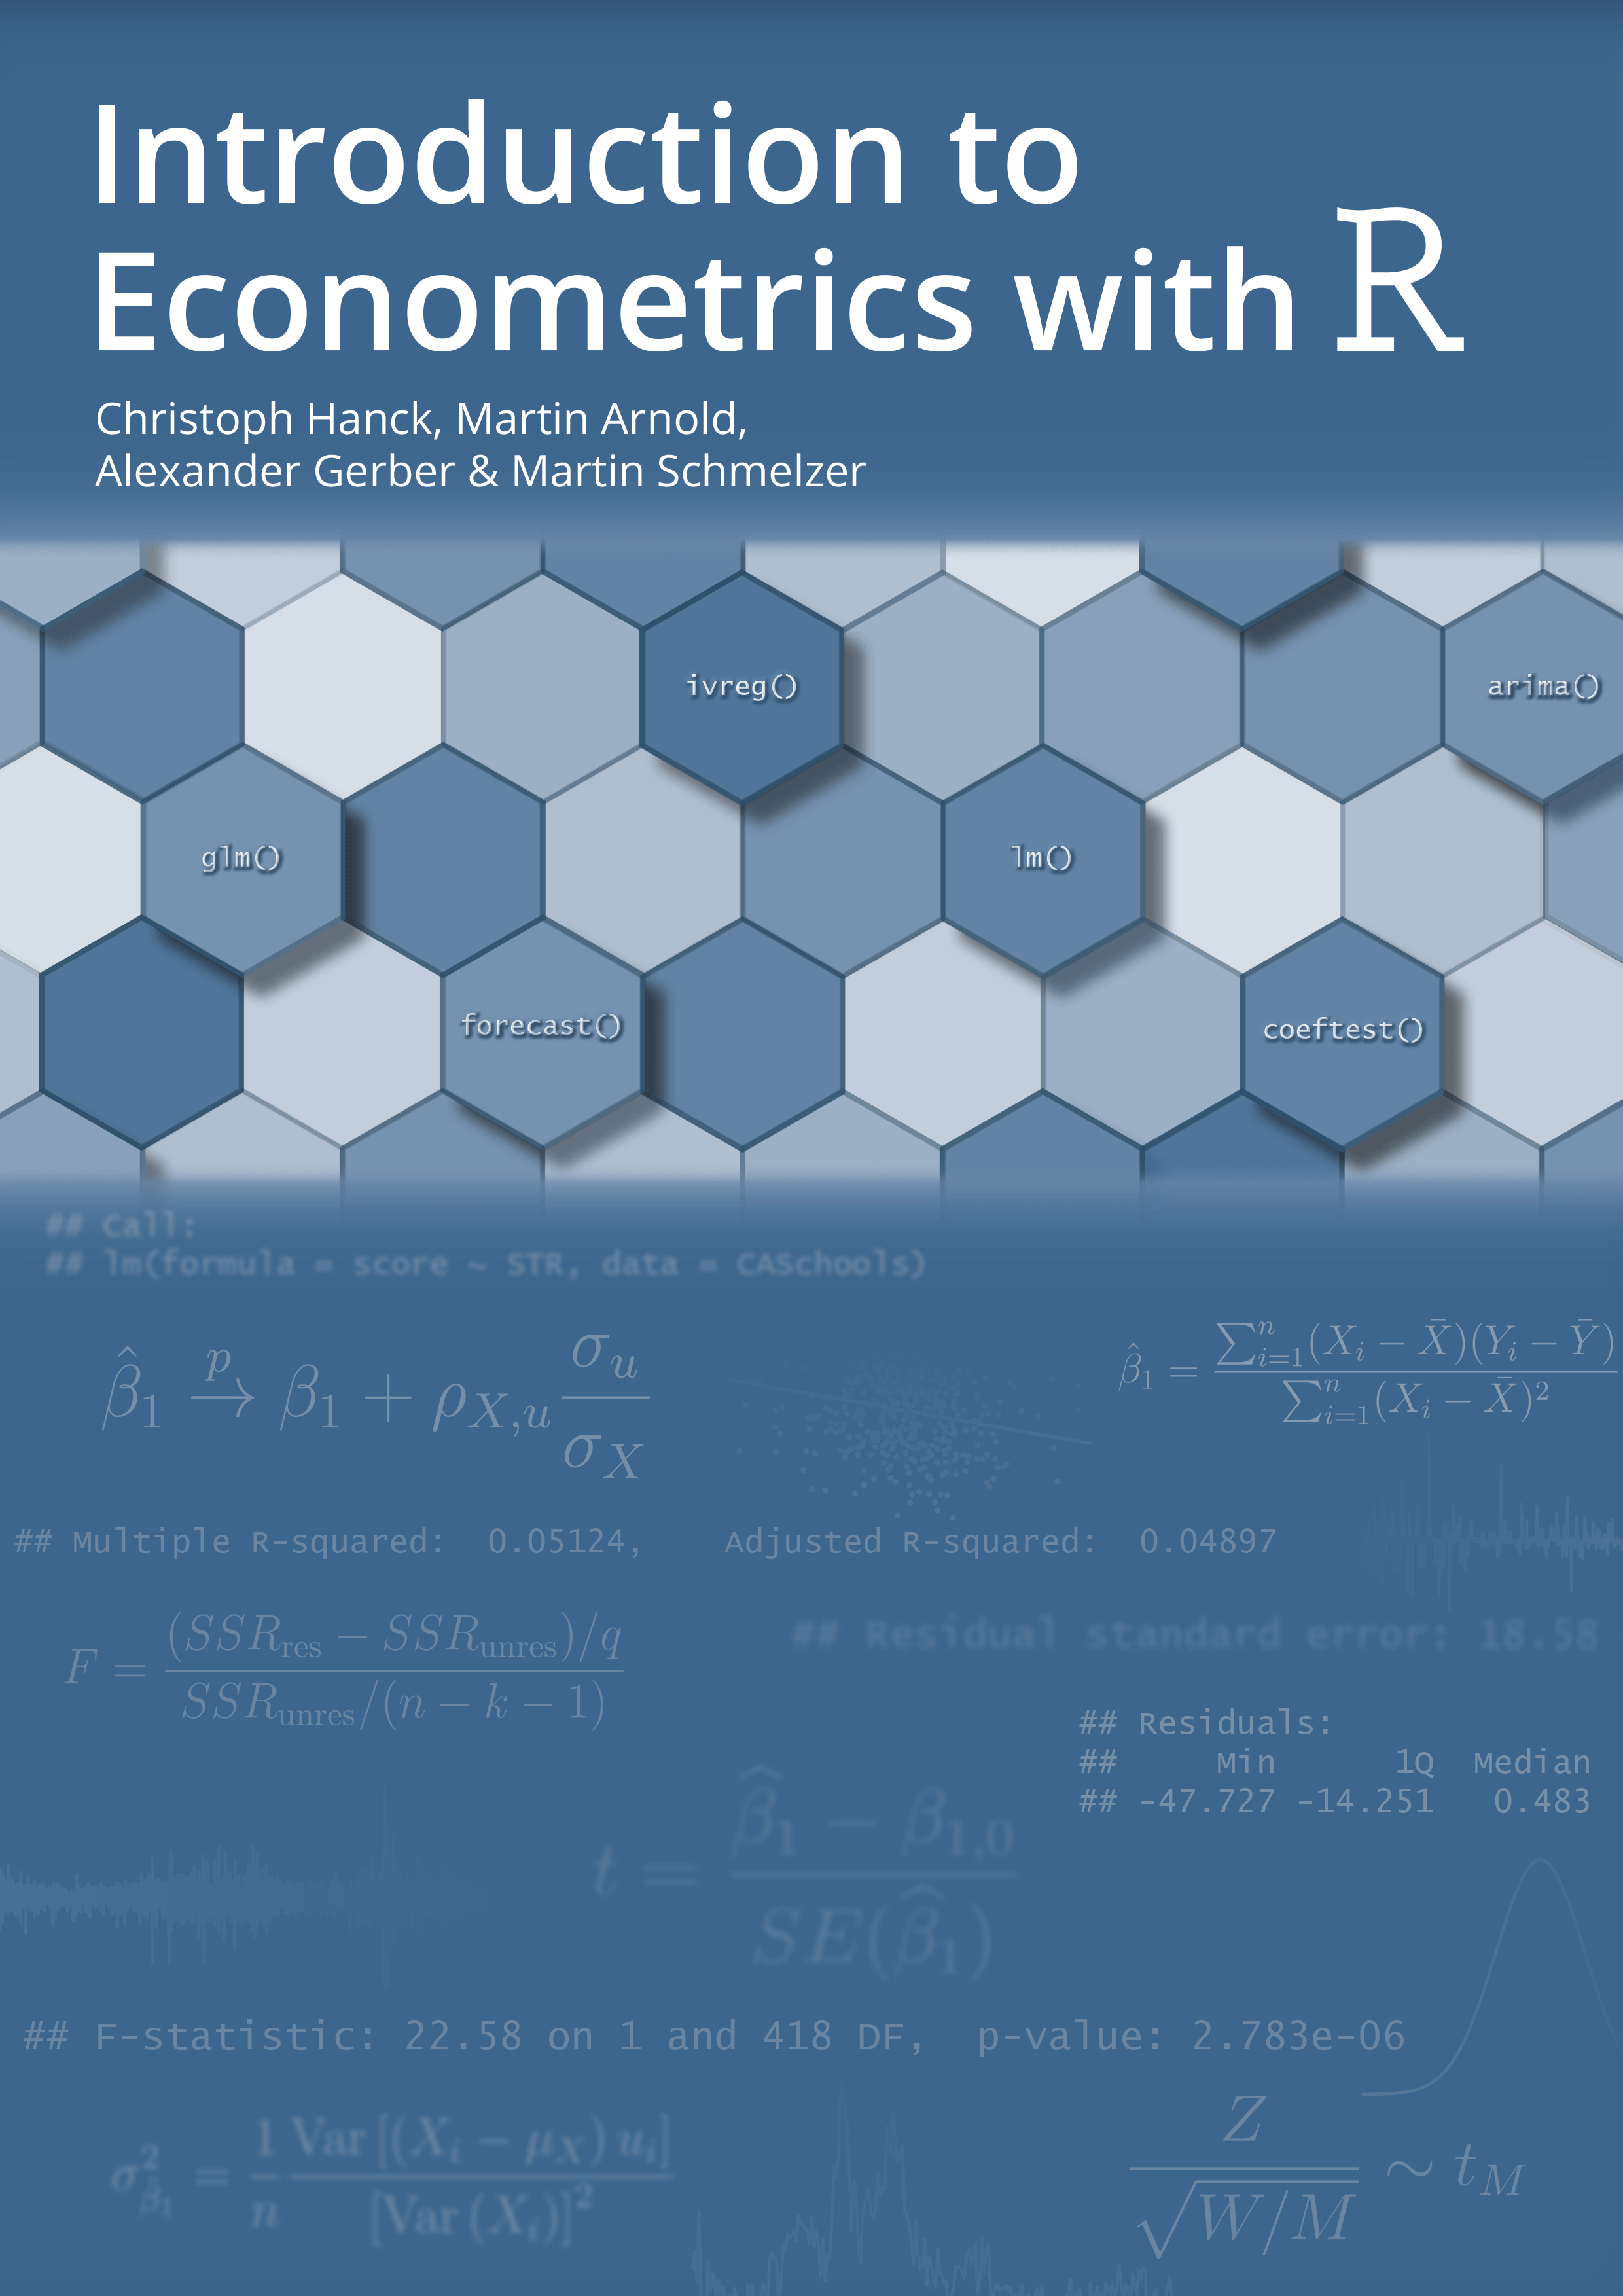
Beginners with little background in statistics and econometrics often have a hard time understanding the benefits of having programming skills for learning and applying Econometrics. ‘Introduction to Econometrics with R’ is an interactive companion to the well-received textbook ‘Introduction to Econometrics’ by James H. Stock and Mark W. Watson (2015). It gives a gentle introduction to the essentials of R programming and guides students in implementing the empirical applications presented throughout the textbook using the newly aquired skills. This is supported by interactive programming exercises generated with DataCamp Light and integration of interactive visualizations of central concepts which are based on the flexible JavaScript library D3.js. Read more →
Reporters Without Borders (RWB)
by Peter Baumgartner
Peter Baumgartner I have finished approximately 30%. This is just a rough guess, derived from my Project plan. Currently I am working on setting up a new navigational structure in 12 New Navigation. I try to implement this new user interface with the different — already prepared — visualizations: line charts for score values, bump charts for rank values, and maps for the country distribution of score values. I am writing this book to learn how to develop a Shiny Dashboard. It is a practical project to support my understanding of Mastering Shiny (Wickham 2021). It was helpful that I have … Read more →
Geocomputation with R
by Robin Lovelace, Jakub Nowosad, Jannes Muenchow
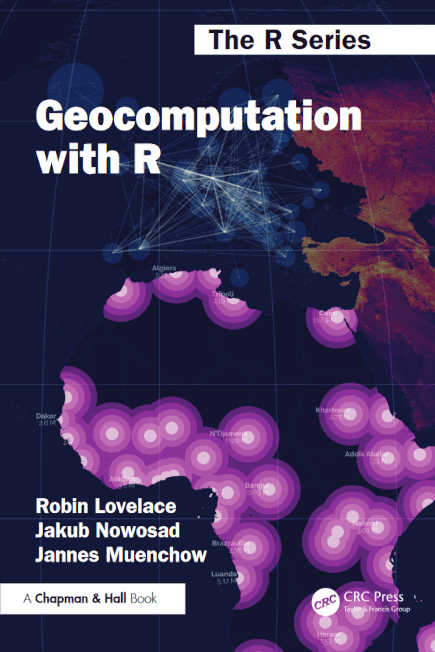
Welcome | Geocomputation with R is for people who want to analyze, visualize and model geographic data with open source software. It is based on R, a statistical programming language that has powerful data processing, visualization, and geospatial capabilities. The book equips you with the knowledge and skills to tackle a wide range of issues manifested in geographic data, including those with scientific, societal, and environmental implications. This book will interest people from many backgrounds, especially Geographic Information Systems (GIS) users interested in applying their domain-specific knowledge in a powerful open source language for data science, and R users interested in extending their skills to handle spatial data. Read more →
Regional Differences in Italian Political Elections
by Domenico Razzano

Data Visualization and Reporting project, […] I would like to thank Giuseppe Nunziata, my Data Visualization and Reporting tutor, for his availability and insightful advice. This report examines electoral results in Republican Italy, specifically addressing regional disparities and the longstanding divide between Northern and Southern Italy. Inspired by the analysis of the 1946 referendum data, which revealed starkly contrasting views between Italians in the North and the South regarding the country’s most crucial institutional question - the future structure of the state - this study … Read more →
Data Analysis and Visualization for Communication Science
by morleyjamesweston
Data Analysis and Visualization for Communication Science […] This class will be the intersection of data analysis, visual design, and communication science. We’ll examine some good and bad data visualizations, and make plenty of our own. No prior knowledge of R will be required to take this course, but students should be prepared to learn a new programming language and to work with data. Short answer: Sure! Just don’t trust them. With a university email address, you can sign up for the GitHub Student Developer Pack, which will let you use the GitHub Copilot AI tool for free. UZH also … Read more →
Data Visualization with R Programming
by สมศักดิ์ จันทร์เอม
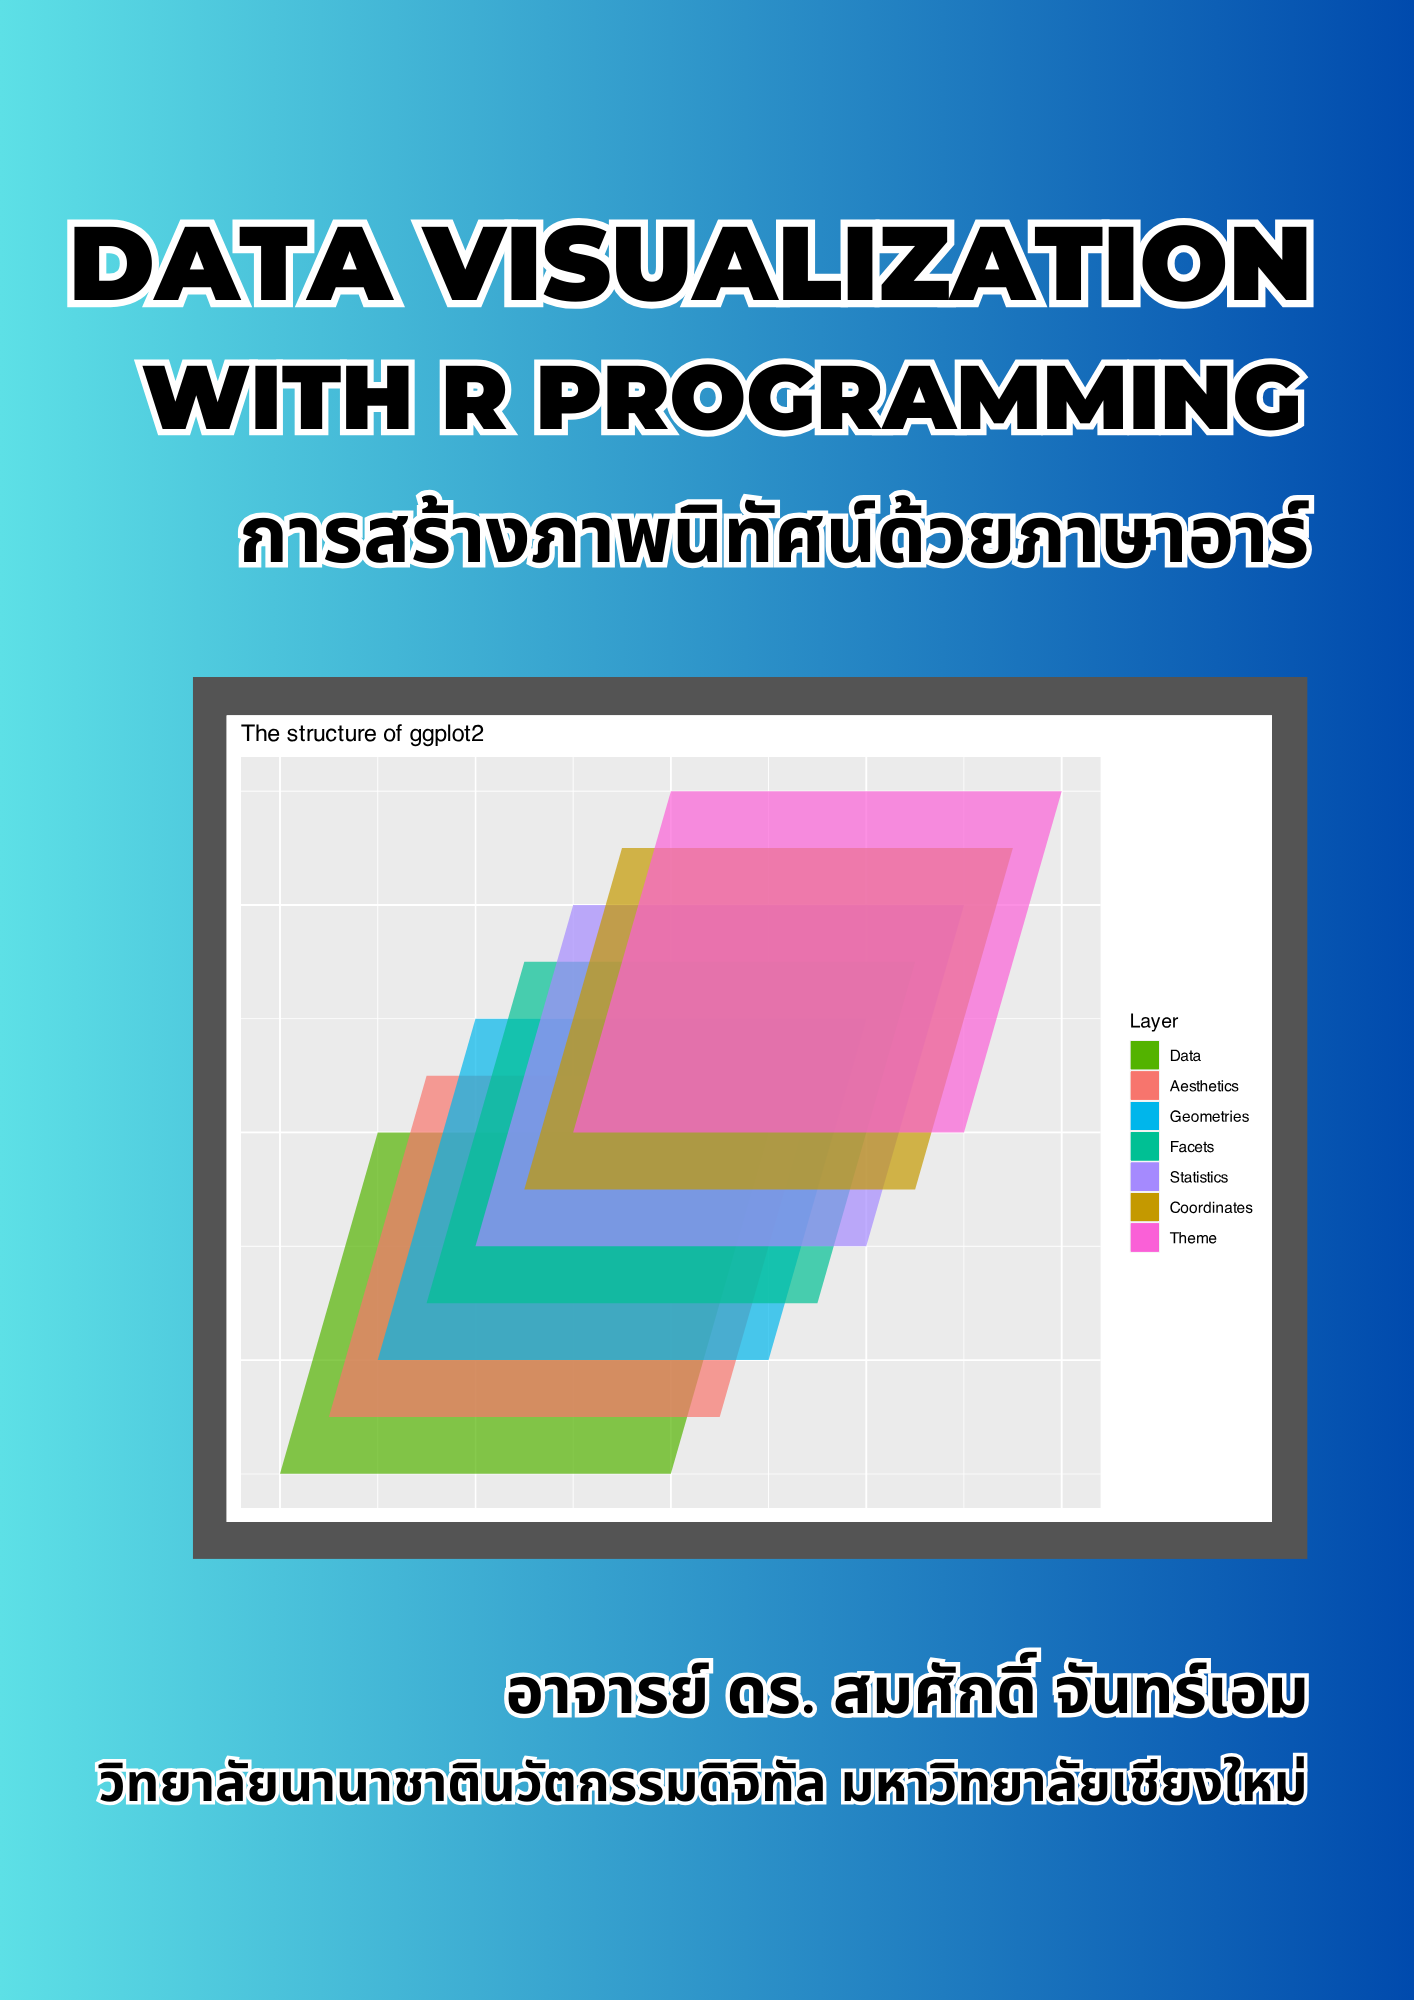
สมศักดิ์ จันทร์เอม ภาพนิทัศน์มีความสำคัญอย่างมากในการทำความเข้าใจข้อมูล และเพื่อประสิทธิภาพในการตัดสินใจ เครื่องมือที่ช่วยในการใช้สร้างภาพนิทัศน์ของข้อมูลในปัจจุบัน มีหลายตัว ในหนังสือเล่มจะใช้ภาษาอาร์ในการเขียนโปรแกรมเพื่อสร้างภาพนิทัศน์ และใช้โปรแกรม RStudio เพื่อช่วยการใช้เขียนโปรแกรมภาษาอาร์ให้มีความสะดวกสบายมากยิ่งขึ้นด้วยเครื่องมือช่วยที่หลากหลาย ในหนังสือเล่มไม่ได้สนใจในประเด็นตัวแบบสถิติ (statistics model) เศรษฐมิติ (econometrics) หรือการเรียนรู้ของเครื่องจักร (machine learning) ด้วยภาษาอาร์ แต่ถ้าผู้อ่านได้ศึกษาและทำความเข้าใจในหนังสือเล่มนี้แล้ว ผู้อ่านจะได้เรียนรู้พื้นฐานการเขียนโปรแกรมภาษาอาร์ที่จำเป็นอย่างมีหลักการ เช่นชนิดของโครงสร้างข้อมูลที่สำคัญคือวัตถุแบบเวคเตอร์ (vector) และกรอบข้อมูล (data frame) … Read more →
UE STADA
by Jaroslava Kankova
This is an online resource developed to support students attending the UE STADA class at the University of Vienna, Austria. You can use the chapter overview on the left to skip through the content. In this session, we will answer the following questions: R is a programming language used mostly for statistical computing and data visualization. Why are we using R and not other software such as SPSS? In this class we will be working in RStudio. The following picture illustrates the difference between R and RStudio: R as the Engine: RStudio as the dashboard: Just as a car needs both an engine and a … Read more →
Exploratory Data Analysis and Visualization
by Luis Alvarez
This book studies exploratory data analysis and data visualization in the context of a university degree in Data Sciences. […] This document is an English translation of the book Análisis Exploratorio de Datos y Visualización, it covers the contents of an introductory course on exploratory data analysis and visualization in a university degree in Data Sciences. Exploratory data analysis is a very broad field, and it is not possible to teach all its aspects in depth in a single course. This course, of an introductory nature, aims to provide a solid foundation in the most important tools in … Read more →
The Data Preparation Journey
by Martin Monkman
Before you can analyze your data, you need to ensure that it is clean and tidy. […] Welcome to The Data Preparation Journey: Finding Your Way With R, a book published with CRC Press as part of The Data Science Series. This is a work-in-progress; the most recent update is 2024-02-25. It is routinely noted that the Pareto principle applies to data science—80% of one’s time is spent on data collection and preparation, and the remaining 20% on the “fun stuff” like modelling, data visualization, and communication. There is no shortage of material—textbooks, journal articles, blog posts, online … Read more →
pctax: Analyzing Omics Data with R
by Chen Peng
Chen Peng Omics technologies have found extensive applications in biology, encompassing disciplines such as microbiome studies, transcriptomics, metabolomics, and beyond. These technologies generate diverse datasets based on distinct methodologies. Following specific upstream processing, omics data is often transformed into feature abundance tables, representing entities like genes, metabolites, or taxa. These feature abundance tables, coupled with experimental design metadata and various annotation data, serve as the foundation for downstream bioinformatics analysis and visualization, … Read more →
Meta-analysis Shiny Application Guideline
by Sangyoung Jung
Sangyoung Jung This application can help data analysis for the meta analysis and data visualization including forest plots and geographical frequency maps. It offers four key benefits: Data Cleaning and Check: The application not only cleanses datasets, preparing elements such as author names for meta-analysis, but also assists in identifying missing values and outliers during data checks. Meta-analysis Model Fitting: It is capable of conducting meta-analysis and moderator analysis with detailed statistics and diagnostic plots. Data Visualization: The application supports data visualization, … Read more →
EGM Shiny Application Guideline
by Sangyoung Jung

Sangyoung Jung Welcome to the “Guideline for EGM Shiny Application.” This guide is meticulously crafted to support you in three critical areas: Data Verification - Dive deep into your data to identify missing values, spot outliers (such as unrealistic publication years), and rectify mismatches in intervention and outcome codes within DEP and EGM frameworks. Chapter 1, Chapter 2, Chapter 3 Visualization - Transform your dataset into insightful visual narratives, from detailed country maps to dynamic charts that illuminate the nexus between interventions and outcomes. Chapter 4 Advanced … Read more →
myCMIE 2.0
by Qi Xu, Jeanne Kowalski
Newsletter | myCMIE 2.0 […] myCMIE, a web application that simplifies Molecular Profiling Reports (MPRs) for cancer treatment decisions. It integrates genomic data, drug options, and clinical trials into a user-friendly platform for efficient treatment insights. myCMIE connects patient data with public datasets, for context-informed treatment and conjecture with therapeutic implication through interactive visualizations and collaborative tools for healthcare stakeholders. The app is deployed on Amazon Web Service (AWS) and is available at: https://kowalski-labapps.dellmed.utexas.edu/CO3inW3/ … Read more →
Economics 395: Forecasting
by Jaya Jha
Economics 395: Forecasting […] This resource is a compilation of Dr. Jaya Jha’s notes and code for Economics 395: Economic Forecasting. This course uses Introduction to Time Series Analysis and Forecasting as the primary textbook.1 The code sections for this class use the same data and visualizations from Introduction to Time Series Analysis and Forecasting, but not the methods.2 The methods used are from Forecasting: Principles and Practice by Rob J. Hyndman and George Athanasopoulos.3 Montgomery, Jennings, and Kulahci, Introduction to Time Series Analysis and Forecasting.↩︎ Montgomery, … Read more →
381M Course Bookdown
by Josephine Lukito
This is a textbook for the course J381M at UT-Austin. […] Welcome to the J381M Textbook! In this course, we will learn how to use R for Computational Communication Research and Data Science, focusing on skills such as data wrangling, basic statistics, data visualization, data collection, NLP, network analysis, and machine learning. This is a survey course that is meant to give you a taste of data science. In truth, many of these topics are rich enough to warrant full courses. This textbook is best paired with the J381M course materials, including lectures, readings, and course assignments. … Read more →
Data Wrangling and Visualization Guide
by Max Ricciardelli
This book is meant to provide a guide to those who have little to no experience in R and R studio to conceptions dealing with data and statistics. R is a powerful tool allowing highly customizable data visualization and offers many different formats and applications to users. […] These modules are here to present a succinct guide to using R, RStudio, and R Markdown for data wrangling and visualization. This guide is meant for those who have little to no experience in programming. My purpose in designing these modules is to provide a brief yet clear guide to learning the basic theory of these … Read more →
AI and Machine Learning For Finance 2022/23
by Michela Cameletti
Notes for the R labs of the AIMLFF course @Unibg […] You are reading the lecture notes of the R lectures for the AI and Machine Learning for Finance (AIMLFF) course at University of Bergamo (academic year 2022/23). See here for more details. In this notes R programming language for data science will be introduced (with respect to data manipulation, data visualization and communication and implementation of machine learning methods). For this part I suggest the following on-line book: Enjoy the journey! In the following lecture notes, this font (with grey background) represents R code. The … Read more →
Teachvatory
by Gonzalo Jara

Welcome | Teachvatory documentation. […] This is a small reference book to learn how to install, edit, and deploy the app Teachvatory. Teachvatory is an app created by Dan Levy and a group of his former students and teaching fellows. Its goal is to provide an easy visualization of student’s performance in the courses that Dan teaches. This book has 5 chapters that covers most of the development process for the app: The first chapter explains how to download and install the app locally. The second chapter explains the app architecture, which follows the R package convention and uses the … Read more →
Data Visualization for International Relations
by Alfredo Hernandez Sanchez, PhD
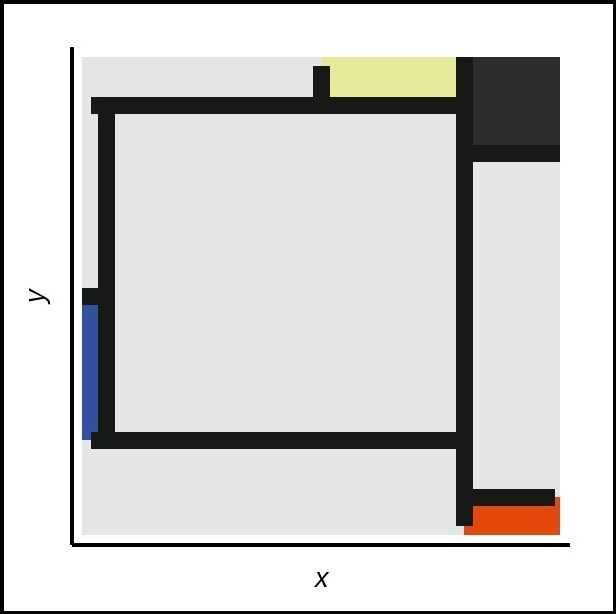
This book is the companion to the MA course Data Visualization at IBEI. […] In an experiment conducted by researchers from University College London (Mcmanus and Gesiak 2014), 277 participants were asked to look at several pairs of paintings: one of the pairs was an original by abstract painter Piet Mondrian, and the other was fake version that closely resembled it.1 The participants where asked: When looking at the pictures you should decide overall which you thinks looks better, in that it looks nicer, it looks better organised, or it looks better balanced. The results suggested that … Read more →
Programming and Applied Data Visualization with R
by Dr. Paul C. Bauer (University of Mannheim)
Q: What is your experience with looking at data analysis code you have written 2 years earlier? Comment your code Use meaningful names! A “new” package dplyr written by Hadley Wickham/Romain Francois replaces many old functions for data management Functions in dplyr are highly performant (big data!) and consistent See this page for an excellent overview and the Data Wrangling Cheat Sheet What could the following functions be used for? Hadley Wickhams ggplot2 Package developed into a powerful alternative to the default plot() function. Its goal is to simplify complex plots (e.g. take care of … Read more →
An Introduction to ggplot2
by Ozancan Ozdemir
A ggplot2 Tutorial […] Hi! Data Visualization is one of the important steps of the data analysis process. It is actually not only part of the data analysis, but also can be considered as an art. R Programming language provides a powerful visualization package to us, ggplot2. This book aims to show how you can make a well-known statistical plots by using ggplot2, and also how you can improve or customize them. The book is created by the lab notes of statistical computing (STAT 291-STAT 292) of Ozancan Ozdemir. For your opinions and suggestions, please send me an e-mail to … Read more →
Data Integration, Manipulation and Visualization of Phylogenetic Trees
by Guangchuang Yu
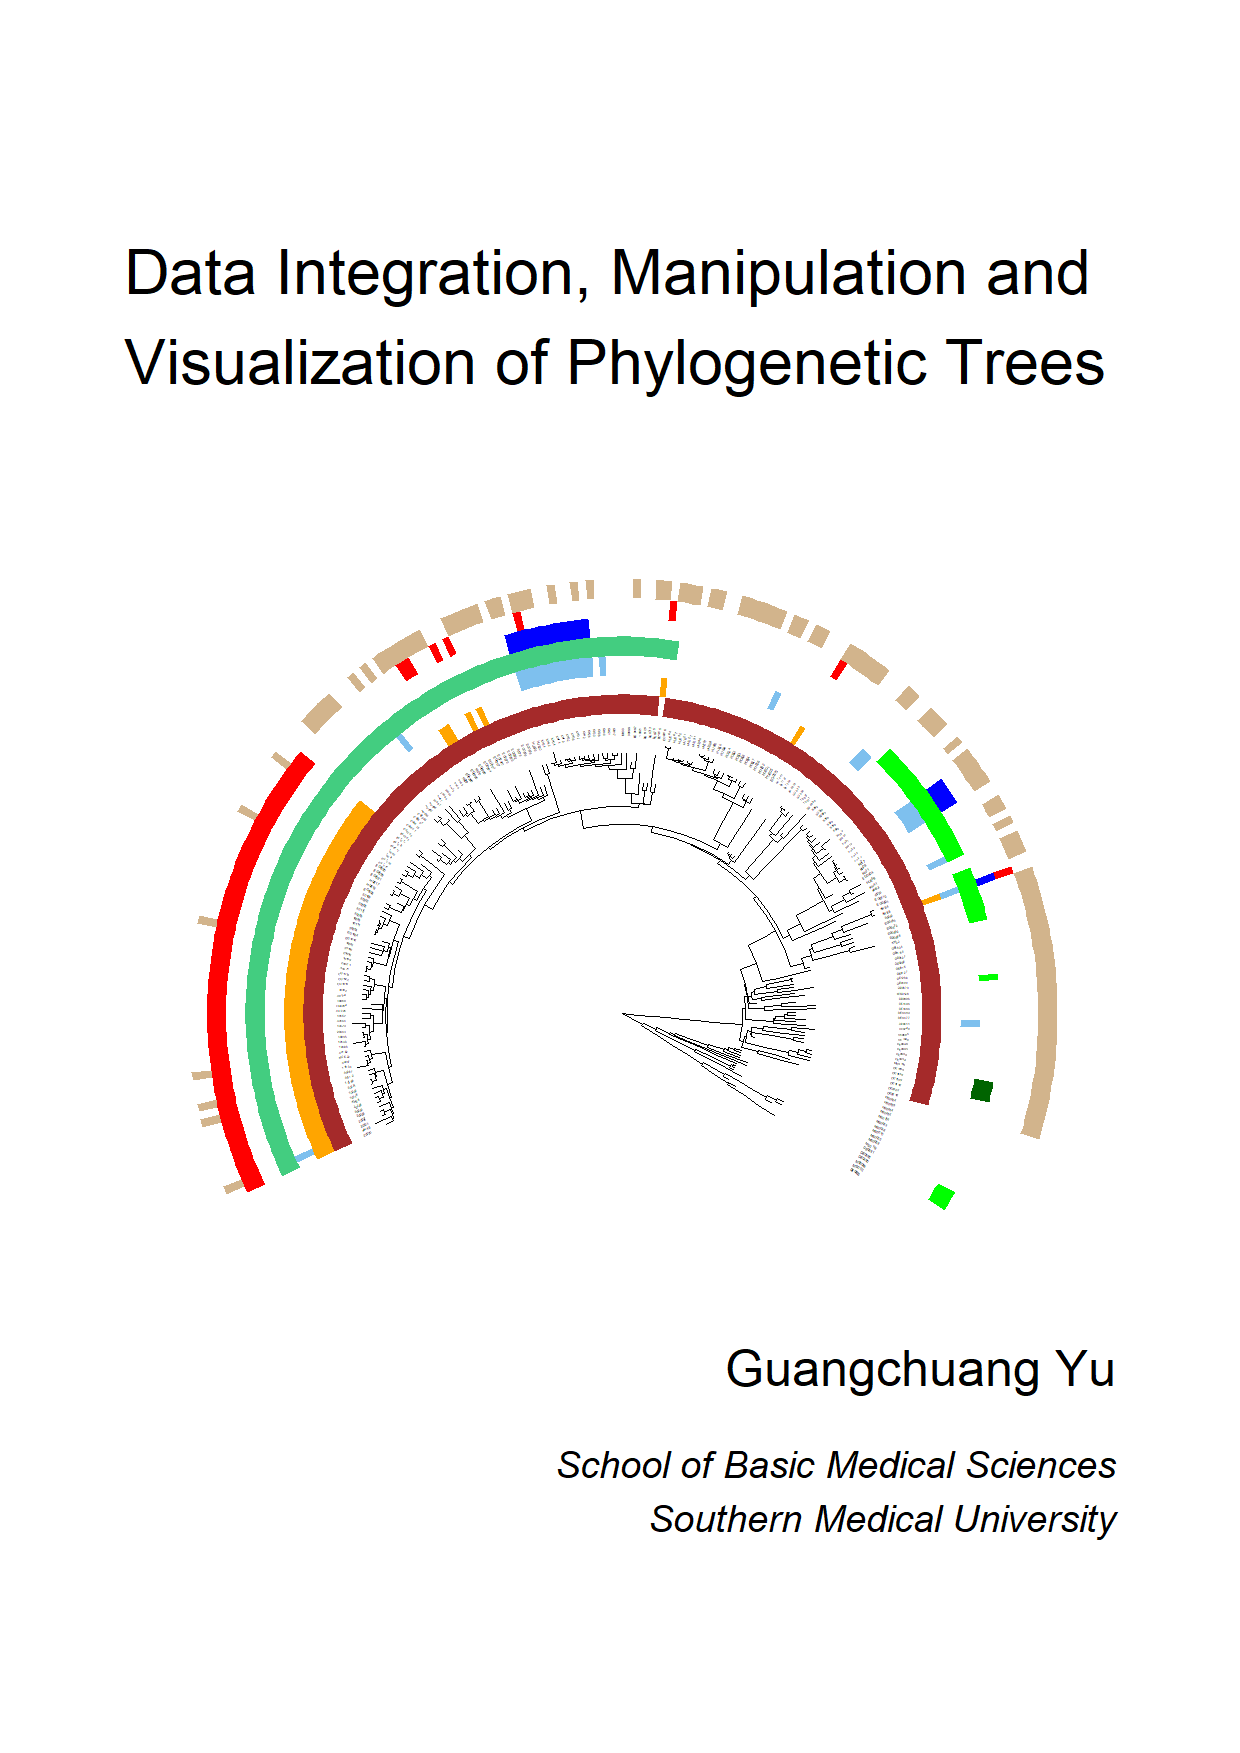
Master ggtree package suite to handle tree with data. […] I am so excited to have this book published. The book is meant as a guide for data integration, manipulation and visualization of phylogenetic trees using a suite of R packages, tidytree, treeio, ggtree and ggtreeExtra. Hence, if you are starting to read this book, we assume you have a working knowledge of how to use R and ggplot2. The development of the ggtree package started during my PhD study at the University of Hong Kong. I joined the State Key Laboratory of Emerging Infectious Diseases (SKLEID) under the supervision of Yi Guan … Read more →
R-Shiny-Book.knit
by loankimrobinson
This book is for the beginner, intermediate and advanced R programmer looking to produce higher level reporting and advanced visualization techniques using R Shiny. […] … Read more →
ISTA 321 - Data Mining
by Nicholas DiRienzo
Course content for ISTA 321 - Last updated for Summer 2022 […] Welcome to ISTA 321 - Data Mining! The goal of this class is to teach you how to use R to make informed inferences and predictions from large datasets using a variety of methods. This requires a mixture of many skills including programming, data exploration and visualizations, statistics, algorithms, machine learning, model validation, and general data wrangling. We don’t do these things in isolation, but instead do them with a goal of answering a question, thus being able to apply this knowledge to make a data-driven decision … Read more →
AI and Machine Learning For Finance 2021/22
by Michela Cameletti
Notes for the R labs of the AIMLFF course @ Unibg […] You are reading the lecture notes of the R lectures for the AI and Machine Learning for Finance (AIMLFF) course at University of Bergamo (academic year 2021/22). See here for more details. In this notes R programming language for data science will be introduced (with respect to data manipulation, data visualization and communication and implementation of machine learning methods). For this part I suggest the following on-line book: Enjoy the journey! In the following lecture notes, this font (with grey background) represents R code. The … Read more →
Epistemic Network Analysis Web Tool User Guide
by tan78
This is an introduction to the Epistemic Network Analysis web tool. […] This is the website for Epistemic Network Analysis Web Tool User Guide. This user guide demonstrates how to conduct an Epistemic Network Analysis (ENA) using the ENA web tool. Topics covered in this user guide include how to format data, upload data, construct an ENA model, perform statistical analysis, understand ENA visualizations, and interpret ENA model. Before you dive into this user guide, please keep in mind that this user guide is designed with a focus on utilizing the web tool itself, instead of discussing the … Read more →
20IMCAL204 STATISTICS LAB- Laboratory Manual
by Department of Mathematics
This manual is generated using Bookdown for internal use only […] This course is designed as a Computational Statistics Laboratory (CSL) comprised of 29 experiments selected from the Statistical Courses in INMCA Programme. Details of experiments and the instructions regarding creation & submission of laboratory reports are explained in this introductory chapter. Familiarization of environments in R. Perform simple arithmetics using R. Perform basic R functions. Use various graphical techniques in EDA. Create different charts for visualization of given set of data. Draw a Pareto chart to … Read more →
An(other) introduction to R
by Felix Lennert
This is a gentle introduction to R and the basic usage of some tidyverse packages (dplyr, tidyr, ggplot2, forcats, stringr) for data manipulation and visualization. […] Dear student, in the following, you will receive a gentle introduction to R and how you can use it to work with data. This tutorial was heavily inspired by Richard Cotton’s “Learning R” (Cotton 2013) and Hadley Wickham’s and Garrett Grolemund’s “R for Data Science” (abbreviated with R4DS). The latter can be found online (Wickham and Grolemund 2016). We will not immediately start out with the packages from the tidyverse … Read more →
Painting the Malaysian Covid Public Data
by Azman Hussin and Wan M Hasni
The book is designed primarily for data science and R beginners who want to learn exploratory data analysis (EDA) through visualization in a practical way by working on actual data related to a real problem. We continue to stress these themes in the book; EDA, visualization, actual data, and learning by solving problems (#learnbydoing). We envisage that the book will only have an online version because of the dynamic nature of the problems related to Covid and the increasing data. The Covid pandemic should be of concern to all. Everyone is affected through being infected, constrained by … Read more →
Coding for Data Science 2021/22 - R part
by Michela Cameletti
Notes for the R labs of the C4DS course @ Unibg […] You are reading the lecture notes of the R lectures for the Coding for Data Science (C4DS) course at University of Bergamo (academic year 2021/22). C4DS is the first module of the course named Coding and Machine Learning (see here for more details). The C4DS R lectures are designed for students who already have a programming background thanks to the first part of the C4DS course dedicated to Python. In this part of the module we will introduce R programming language for data science (including data manipulation, data visualization and … Read more →
Data Visualization for Conservation
by Gavin Masterson
This book contains all the content for, and information relevant to, the Data Visualization for Conservation course (7 July - 20 July 2021). […] Welcome to the Data Visualization for Conservation course! In this course we are going to be talking about data visualisation or ‘dataviz.’ We will spend time talking about the importance of data visualisation, learning how to produce custom visualisations using the ggplot2 package, as well as an important theory of data management and storage. The path of learning is never-ending, and we do not want you to imagine that this course can teach you … Read more →
Data Visualization Workshop
by Taia Wu
Data Visualization Workshop […] “The greatest value of a picture is when it forces us to notice what we never expected to see.” — John W. Tukey This bookdown was created for a 2-hour minicourse on data visualization for students in the 2021 UCSF Science and Health Education Partnership Highschool Internship Program (SEP HIP). Interns – welcome! You can use this website and all of its resources during and after the workshop. Anyone else – welcome, also! Feel free to use what you find here for educational purposes. If you do, please cite this book and/or include the URL where you use these … Read more →
2021 REU Data Science Training
by Haoqi Wang
2021 REU Data Science Training […] Knowledge Gained: R, data wrangling, data visualization Main materials: Other resources Software: R Weekly Time-Commitment: 3-6 hrs of independent asynchronous work by students supplemented with ~1-3 hours of grad student led synchronous support. Asynchronous work: working through video tutorials Synchronous … Read more →
STA 141 - Exploratory Data Analysis and Visualization
by Derek L. Sonderegger
STA 141 - Exploratory Data Analysis and Visualization […] The history of advertisement is full of examples of false advertisement. In the United States, the Federal Trade Commission regulates advertisement and can level fines for deceptive or misleading ads. As a result, the ads typically say true, but misleading facts. The shift to people getting information from social media sources has exacerbated the problem. With hundreds of automated accounts on a media site, a disinformation campaign can continually present their information without suffering any penalty. In order to be compelling, … Read more →
Data Visualization with PowerBI
by Mohamed Kassem
This course is intended for educational puposes & preparing Data analysts for Exam DA-100: Analyzing Data with Microsoft Power BI : Creating reports […] This course is intended for educational purposes & preparing Data analysts for Exam DA-100: Analyzing Data with Microsoft Power BI : Creating reports All the needed resources to follow along can be found here https://github.com/Mkassem16/NycTaxiPBI. Creating basic PowerBI reports knowledge is prerequisite for this course. By the end of this course Data Analysts should be able to: + Customize Report pages. + Decide for appropriate … Read more →
Introduction to R (Part 2)
by Nana Kim
A document for Intro to R workshop (part 2) video […] In the next two chapters, we will learn how to manipulate and visualize data. We will use tidyverse packages (mainly dplyr, ggplot2, and tidyr) for easier and faster data manipulation/visualization. First, install and load the tidyverse by running: * Visit https://www.tidyverse.org/ to learn more about the … Read more →
R Gallery Book
by Kyle W. Brown
This is the complete guide to the R Gallery. […] Welcome the R Gallery Book, a complete guide to the R Graph Gallery website. This information is taken directly from R graph gallery with careful detail in reproducing plots and completing ideas. This material created by Kyle W. Brown as way to have one single reading collection of updated R gallery plots and graphs. While this book was created to encapsulate the entire R Graph Gallery website into one readable source, another purpose is serving as introductory level into data visualization using R programming … Read more →
Analyzing and visualizing fiber photometry data with fluoR
by Andrew Tamalunas
A living bookdown document focused on exploration, visualization, and analysis of neurobiological time series data - especially in the context of testing behavioral hypothesis. […] Analyzing and visualizing fiber photometry data with fluoR is a continuously updated book of tutorials and background information for analyzing and visualizing time series data from behavioral experiments. The fluoR R package is the successor to the GCalcium package, which I initially wrote to help ensure that my fiber photometry data analyses were accurate, consistent, and transparent. Both R packages and this … Read more →
Mastering Software Development in R
by Roger D. Peng, Sean Kross, and Brooke Anderson
The book covers R software development for building data science tools. As the field of data science evolves, it has become clear that software development skills are essential for producing useful data science results and products. You will obtain rigorous training in the R language, including the skills for handling complex data, building R packages and developing custom data visualizations. You will learn modern software development practices to build tools that are highly reusable, modular, and suitable for use in a team-based environment or a community of developers. Read more →
Introduction to Data Science
by Ron Sarafian
Class notes for the BGU course - Introduction to Data Science. […] This book accompanies the course I give at Ben-Gurion University, named “Introduction to Data Science”. This is an introductory-level, hands-on focused course, designed for students with basic background in statistics and econometrics, and without programming experience. It introduces students to different tools needed for building a data science pipeline, including data processing, analysis, visualization and modeling. The course is taught in R environment. Many of the contents in this book are taken from BGU’s “R” course, … Read more →
R Software Handbook
by Evaluation, Statistics, and Methodology - University of Tennessee, Knoxville
This is a handbook to help UTK Evaluation, Statistics, and Methodology students learn important R skills. […] Welcome to the R Handbook for ESM Students. This handbook is a hands-on guide to help you learn R. It will take you from installation and set up, to data cleaning, analysis, visualization, and reporting. This guide uses real data to help you practice with R. Specifically, it uses survey data from the RStudio Learning R Survey. It also includes data from built-in R data sets and simulated data. R is a free, open-source programming language for statistics and data visualization. It is … Read more →
Applied Spatio-temporal Statistics
by Trevor Hefley
Course notes for Applied Spatio-temporal Statistics (STAT 764) at Kansas State University […] This document contains the course notes for Applied Spatio-temporal Statistics at Kansas State University (STAT 764). During the semester we will cover construction and analysis of spatial, time series, and spatio-temporal data sets. Topics include data generation using geographic information systems, exploratory data analysis and visualization, and descriptive and dynamic spatio-temporal statistical … Read more →
Practical Data Science
by Michael Clark

The focus of this document is on data science tools and techniques in R, including basic programming knowledge, visualization practices, modeling, and more, along with exercises to practice further. In addition, the demonstrations of most content in Python is available via Jupyter notebooks. […] Michael Clarkhttps://m-clark.github.io/ … Read more →
DondeRs Group
by Henrik Eckermann
This bookdown-project contains introductory material to learn the R programming language […] Instructor: My name is Henrik. I am a PhD-candidate in the Developmental Psychobiology lab group at the Donders Institute in Nijmegen. I find that the R programming language is an extremely useful tool for Scientists, especially (but not only) for data analysis and visualization. I can help you learning the basics of the R programming language and how to approach learning a programming language so you can advance in learning whatever is needed in your specific field. Target audience: Anyone at … Read more →
Using Data Visualization & Storytelling to Gain Organizational Buy-in
by Jake Miter
Guidance for I-O Psychologists on presenting data to influence organizational decision making […] A special thanks to Rob Stilson, Ph.D., for his guidance and advise in writing this white … Read more →
Data Visualization Design Project
by Joshua Ganz, Julian Mucha & Eric Rwabuhihi
This is a minimal example of using the bookdown package to write a book. The output format for this example is bookdown::gitbook. […] Millions of people around the world like to watch football, commonly known as soccer in the United States. It is the most watched sport in Europe, Asia, and Africa. Most recently, the United States has attracted many fans, due in part to the US women’s soccer team, which has won the FIFA Women’s World Cup on four occasions since its inauguration in 1991. The goal of this project is to analyze how teams performed in the world cup in the last 28 years: country … Read more →
Data Analysis for Psychology in R (dapR1) - Labs
by Department of Psychology, University of Edinburgh
This is the page that contains the course labs materials […] Data Analysis for Psychology in R 1 (dapR1) is your first step on the road to being a data, programming and applied statistics guru! This course provides a introduction to data, R and statistics. It is designed to work slowly through conceptual content that form the basis of understanding and working with data to perform statistical testing. At the same time, we will be introducing you to basic programming in R, covering the fundamentals of working with data, visualization and simple statistical tests. The overall aim of the … Read more →
How to Build a Shiny Application from Scratch
by Hadrien@rstudio.com
How to Build a Shiny Application from Scratch […] Shiny is a powerful R package which allows you to create interactive web applications using the R programming language. It is particularly useful for creating applications that run on data and include some sort of data analysis or visualization. In addition to leveraging the power of R and its thousands of packages, one of the big benefits of shiny is the ease of developing applications using R only. Although it is possible to incorporate more traditional web design languages such as custom CSS or Javascript into your shiny application, it … Read more →
Data Visualization in R
by Brooke Anderson
Online booklet for conference workshop on data visualization with R, geared to those who have never used R. […] I have based this workshop on examples for you to try yourself, because you won’t be able to learn how to program unless you try it out. I’ve picked example data that I hope will be interesting to Navy and Marine Corp public health researchers and practitioners. You can download the slides from the workshop by clicking here. To try out these examples, you need some set-up: This section will walk you through each step. R is free and open-source software. You can download a copy for just … Read more →
Gijón Air Pollution - An exercise of visualization and forecasting
by Sergio Berdiales
Gijón Air Pollution - An exercise of visualization and forecasting […] My name is Sergio Berdiales and I am a Data Analyst with more than ten years experience in Customer Experience and Quality areas. If you want to know more about me or contact me you can visit my Linkedin profile or my Twitter account. This is my final project for the Kschool Master on Data Science (8th edition). The main objective of this project is to show I can apply the acquired knowledge during the master’s course in a practical way . The Master on Data Science of Kschool is a 230-hour course which includes Python … Read more →
Visualization
by Stanford Data Lab
This is a book on data visualization using ggplot2 created for the Stanford Data Challenge Lab. […] This is a … Read more →
Macroeconomics
by Mau-Ting Lin
This is a collection of the discussion lists from Macroeconomics. […] The theory contents will follow 1 closely. Item 2 is for data visualization. And item 3 is for general discussion regarding world news. https://goo.gl/kbQwP5 Class participation and quizzes: 10% Midterm Exam: 30% Final Exam: 30% Others Rhttp://www.r-project.org/ RStudiohttp://rstudio.org/ Github desktophttps://desktop.github.com/ … Read more →
Data Visualization Project
by Chiayi Yen
Data Visualization Project […] This study aims at investigating how the change of information dissemination process would affect the window-dressing behaviors of mutual fund managers. By convention, window-dressing is defined as the portfolio manipulations right before the quarter-end date, when all the fund managers are required to disclosure their holding firms of that date. Over the past decades, technological progresses largely change the way how information disseminates, and these further influence the information flow of capital markets. For example, the implementation of “Electronic … Read more →
Data visualization
by Mau-Ting Lin
This is a collection of data visualization handouts from Macroeconomics. … Read more →
Data Science and Visualizations with R
by Jonathan Wong
Data Science and Visualizations with R […] This is a course on the use of tidyverse packages tidyverse provides a complete suite of modern data-handling tools. It is an essential toolbox for any data scientist using R. The tidyverse package is designed to be easy to install. This course will dive into using tidyverse. It will assume you have already installed r and rstudio and how some familiarity on how to use the rstudio. This book will use the nycflights13 dataset This package contains information about all flights that departed from NYC in 2013: 336,776 flights with 16 variables. To … Read more →
The Art of Data Science
by Roger D. Peng and Elizabeth Matsui
The book covers R software development for building data science tools. As the field of data science evolves, it has become clear that software development skills are essential for producing useful data science results and products. You will obtain rigorous training in the R language, including the skills for handling complex data, building R packages and developing custom data visualizations. You will learn modern software development practices to build tools that are highly reusable, modular, and suitable for use in a team-based environment or a community of developers. Read more →
Premier League Annual
by Andrew Clark
Premier League Annual […] This is an ‘on the fly’ annual based on the 2016/17 Premier League season, updated weekly with charts, tables, highlight videos and trivia related to the games played. Each chapter features static visualizations relevant to the games that week. Greatly extended, fully-interactive and constantly updated versions can be found on the accompanying dashboard site Additional data is available at the Premier League Web site Most of the underlying data is unofficial, unguaranteed error-free and available for a million dollars. There is also likely to be use of James … Read more →
Data Visualization
by Kieran Healy
A practical introduction. […] Published by Princeton University Press. Incomplete draft. This version: 2018-04-25. You should look at your data. Graphs and charts let you explore and learn about the structure of the information you collect. Good data visualizations also make it easier to communicate your ideas and findings to other people. Beyond that, producing effective plots from your own data is the best way to develop a good eye for reading and understanding graphs—good and bad—made by others, whether presented in research articles, business slide decks, public policy advocacy, or media … Read more →
edav.info v2
by Joyce Robbins
Joyce Robbins This is edav.info version 2.0! The first version of edav.info is still available, but will no longer be updated. With this resource, we try to give you a curated collection of tools and references that will make it easier to learn how to work with data and create visualizations in R. This resource is tailored to the graduate courses I teach at Columbia University, specifically to provide the how-to on creating graphs. It is important to note that for the most part it does not replicate the class lectures that cover principles of effective graphical design. (Note. edav.info 2.0 … Read more →
Fundamentals of Data Visualization
by Claus O. Wilke
A guide to making visualizations that accurately reflect the data, tell a story, and look professional. […] This is the website for the book “Fundamentals of Data Visualization,” published by O’Reilly Media, Inc. The website contains the complete author manuscript before final copy-editing and other quality control. If you would like to order an official hardcopy or ebook, you can do so at various resellers, including Amazon, Barnes and Noble, Google Play, or Powells. The book is meant as a guide to making visualizations that accurately reflect the data, tell a story, and look professional. … Read more →
Introduction to Data Science
by Rafael A. Irizarry

This book introduces concepts and skills that can help you tackle real-world data analysis challenges. It covers concepts from probability, statistical inference, linear regression and machine learning and helps you develop skills such as R programming, data wrangling with dplyr, data visualization with ggplot2, file organization with UNIX/Linux shell, version control with GitHub, and reproducible document preparation with R markdown. Read more →
Modern Data Visualization with R
by Robert Kabacoff
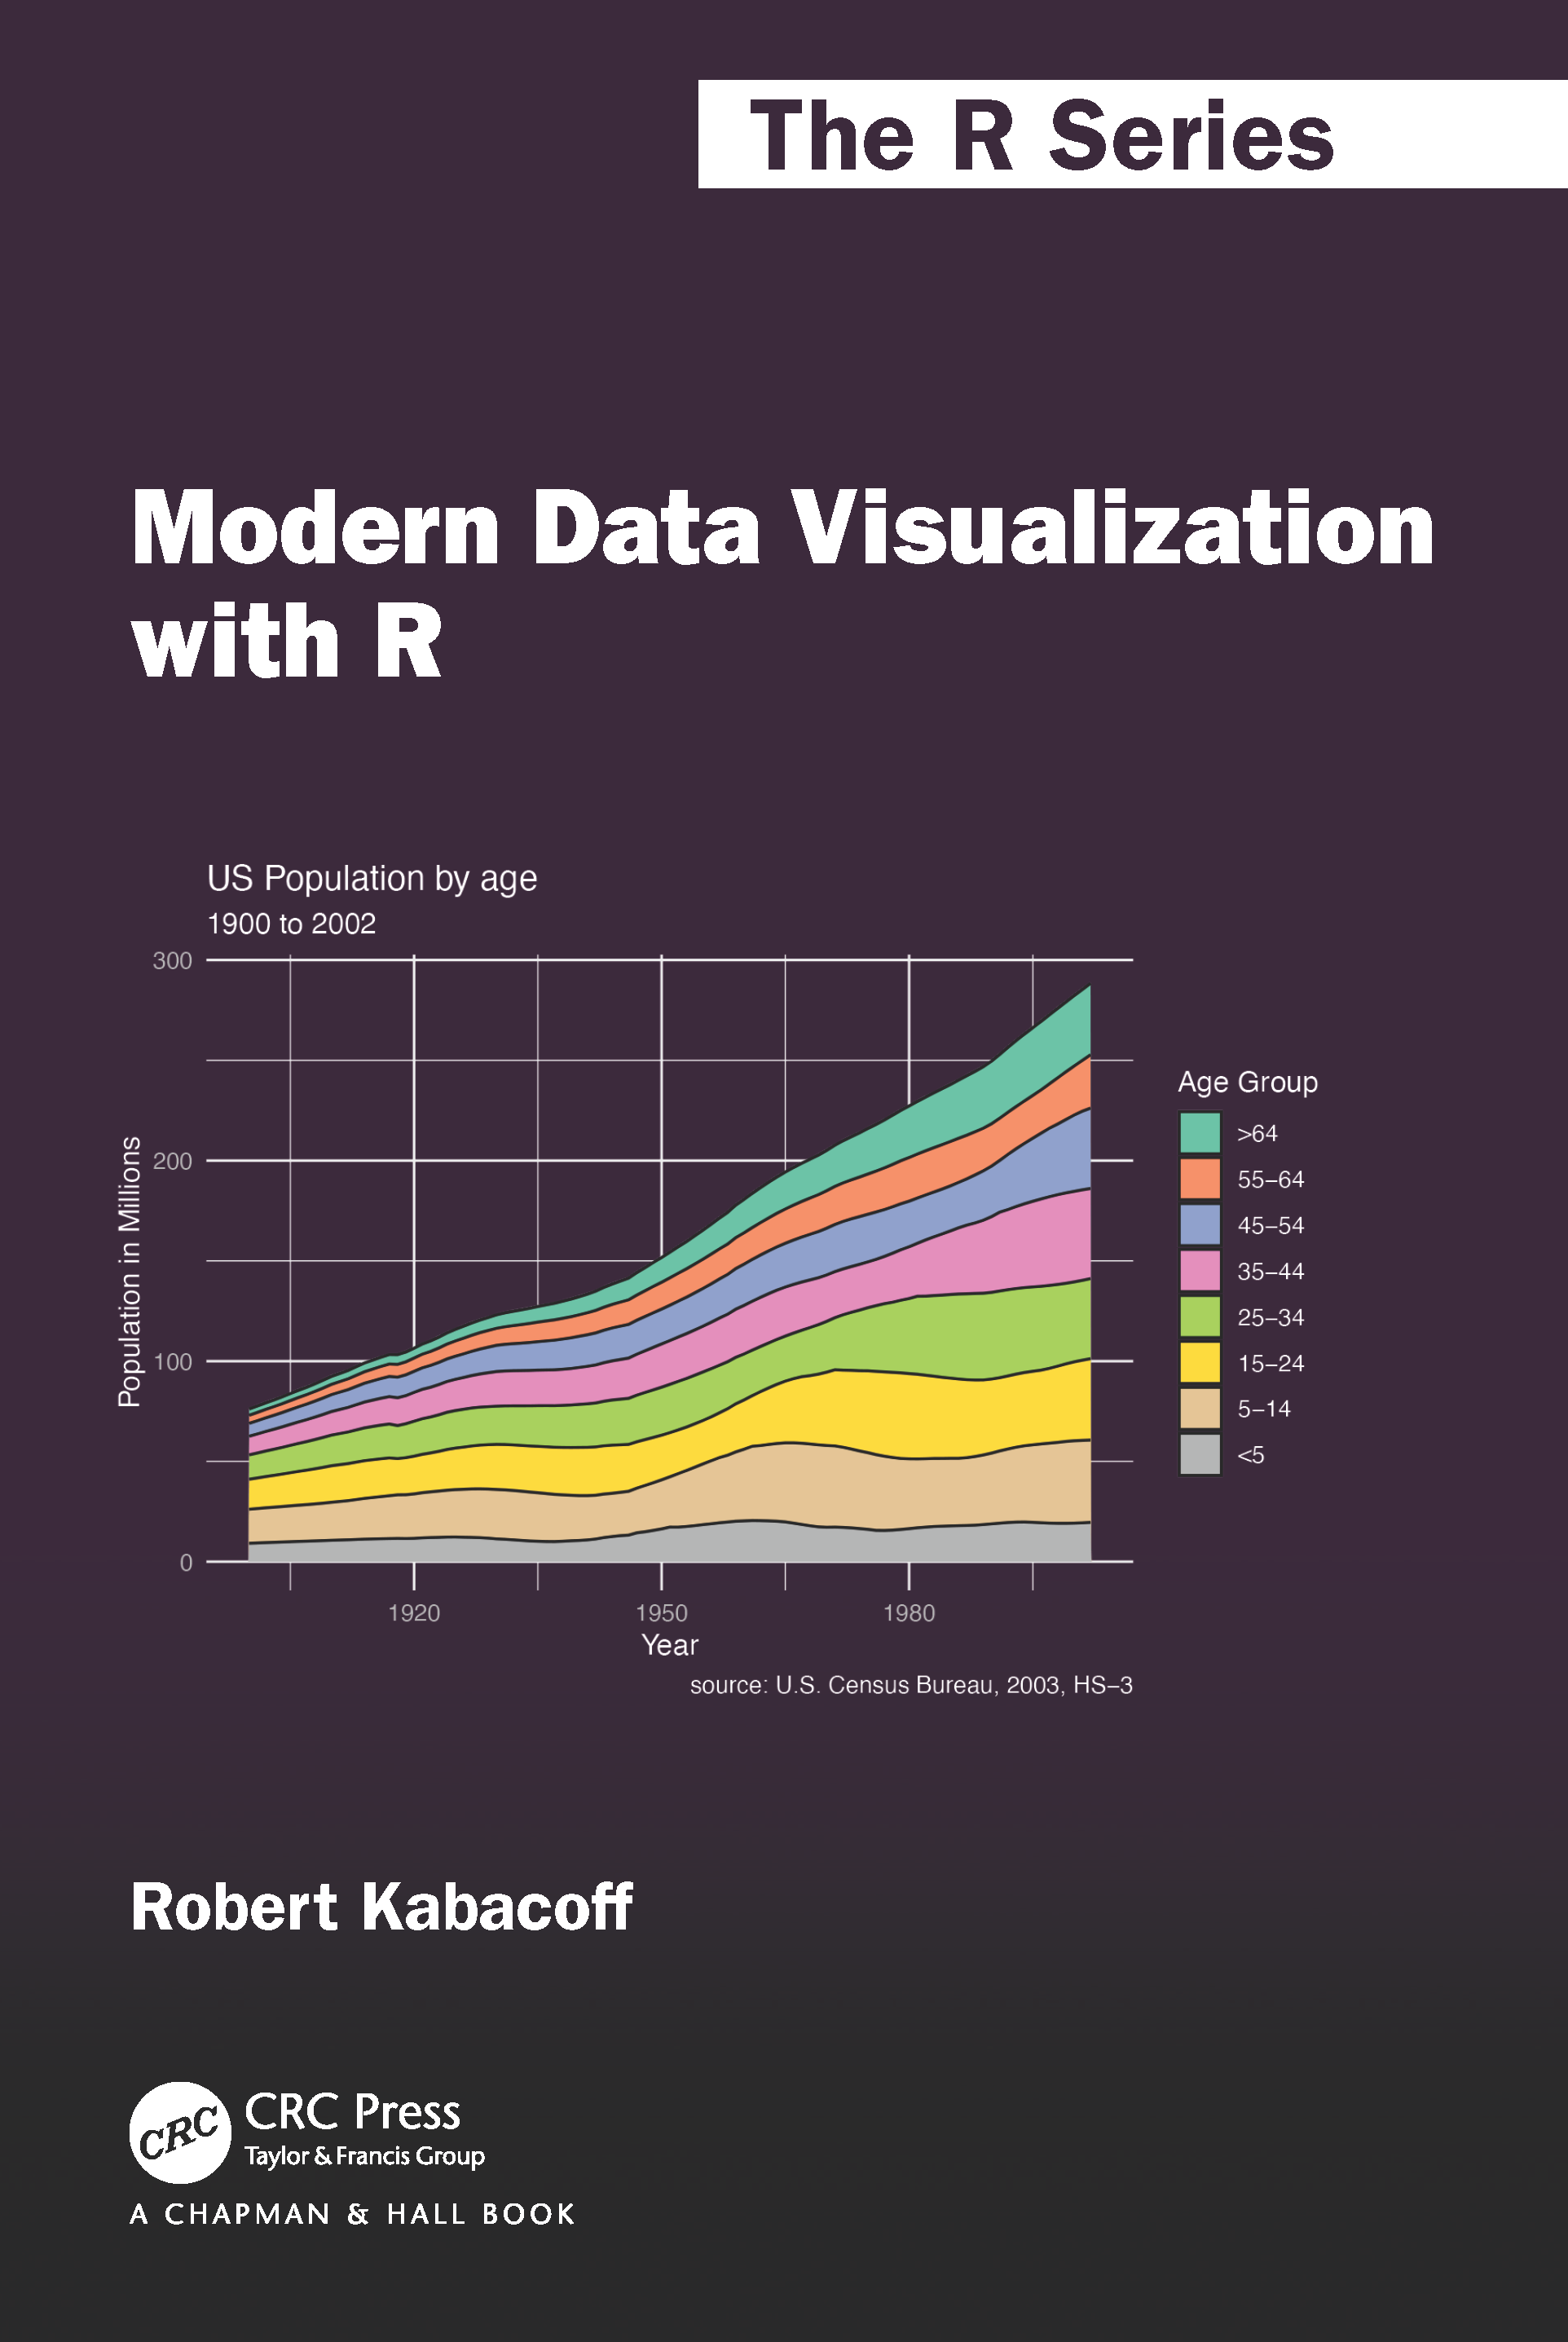
This is an illustrated guide for creating data visualizations in R. […] This is the online version of “Modern Data Visualization with R”, published by CRC Press. A print version is also available from Amazon. R is an amazing platform for data analysis, capable of creating almost any type of graph. This book helps you create the most popular visualizations - from quick and dirty plots to publication-ready graphs. The text relies heavily on the ggplot2 package for graphics, but other approaches are covered as well. My goal is make this book as helpful and user-friendly as possible. Any … Read more →