40.7 Descriptive Tables
Produce journal-quality descriptives and regression tables. Below are multiple options to match target outlet styles (APA, AER, WSJ, etc.)
# Example with gtsummary: one-table overview
if (requireNamespace("gtsummary", quietly = TRUE)) {
  library(gtsummary)
  movies_small %>%
    mutate(
      across(c(budget, us_gross), log1p),
      score_group = cut(metascore,
                       breaks = quantile(metascore, probs = c(0, .5, 1)),
                       include.lowest = TRUE,
                       labels = c("Low score", "High score"))
    ) %>%
    select(metascore, budget, us_gross, runtime, year, score_group) %>%
    tbl_summary(
      by = score_group,
      statistic = list(all_continuous() ~ "{mean} ({sd})"),
      digits = all_continuous() ~ 1
    ) %>%
    add_overall() %>%
    add_p() %>%
    bold_labels()
}| Characteristic | Overall N = 8311 |
Low score N = 4311 |
High score N = 4001 |
p-value2 |
|---|---|---|---|---|
| metascore | 63.0 (16.9) | 50.0 (11.3) | 77.1 (8.7) | <0.001 |
| budget | 17.4 (1.2) | 17.7 (0.9) | 17.2 (1.3) | <0.001 |
| us_gross | 17.9 (1.4) | 17.9 (1.2) | 18.0 (1.5) | 0.3 |
| runtime | 1.9 (0.4) | 1.9 (0.3) | 2.0 (0.4) | 0.004 |
| year | 2,002.2 (9.0) | 2,003.0 (8.0) | 2,001.3 (9.9) | 0.056 |
| 1 Mean (SD) | ||||
| 2 Wilcoxon rank sum test | ||||
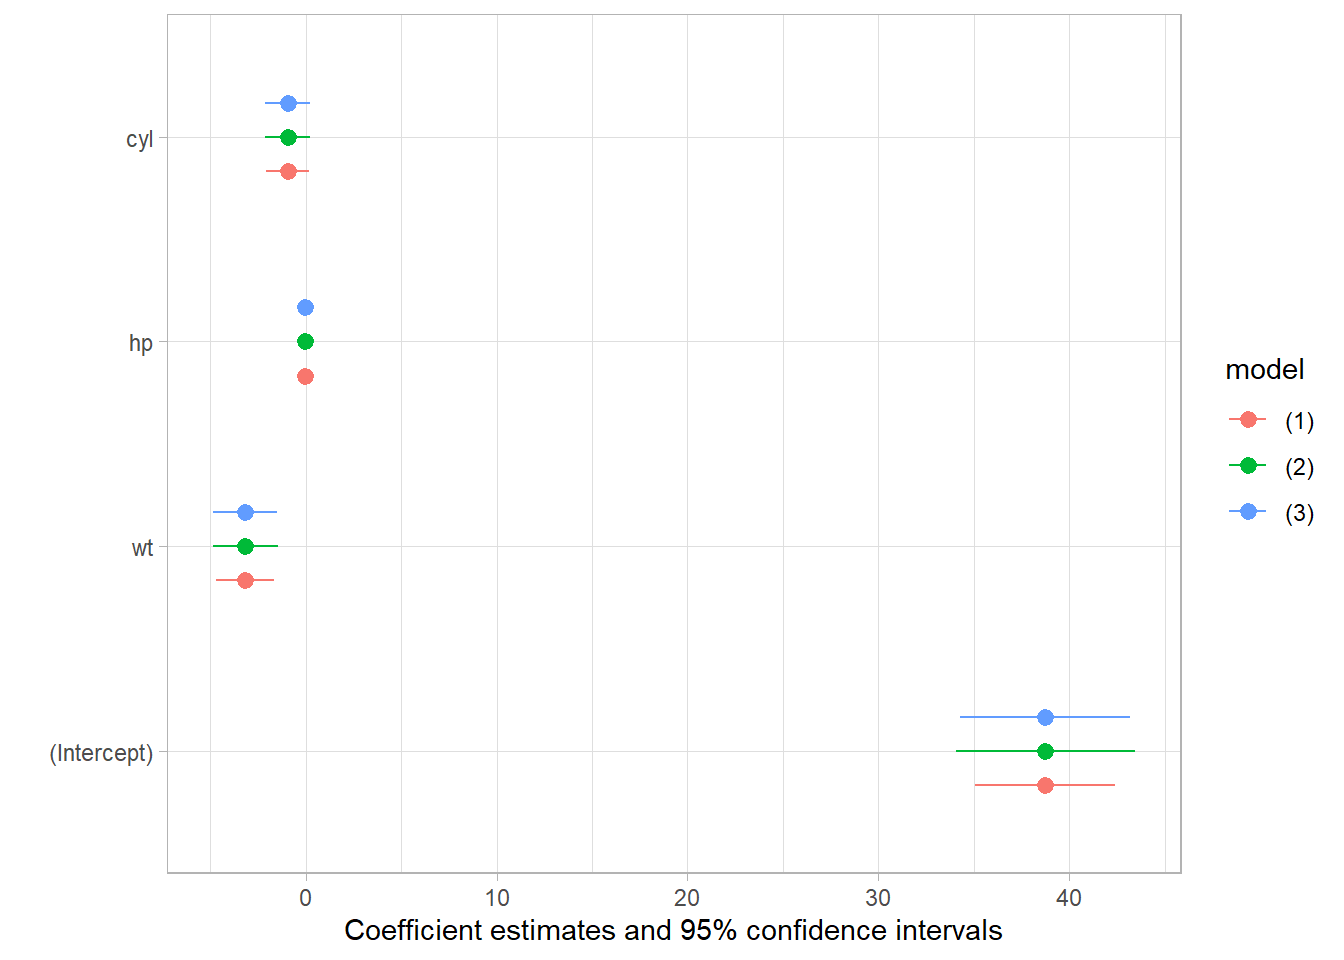
# modelsummary example
if (requireNamespace("modelsummary", quietly = TRUE)) {
  library(modelsummary)
  lm_mod <- lm(mpg ~ wt + hp + cyl, mtcars)
  msummary(lm_mod, vcov = c("iid","robust","HC4"))
  modelplot(lm_mod, vcov = c("iid","robust","HC4"))
}
# stargazer examples, including correlation and ASCII output
if (requireNamespace("stargazer", quietly = TRUE)) {
  library(stargazer)
  stargazer(attitude)

  linear.1 <- lm(rating ~ complaints + privileges + learning + raises + critical, data = attitude)
  linear.2 <- lm(rating ~ complaints + privileges + learning, data = attitude)

  attitude$high.rating <- (attitude$rating > 70)
  probit.model <- glm(high.rating ~ learning + critical + advance,
                      data = attitude,
                      family = binomial(link = "probit"))

  stargazer(linear.1, linear.2, probit.model,
            title = "Results",
            align = TRUE)

  # ASCII text output with CI
  stargazer(
    linear.1,
    linear.2,
    type = "text",
    title = "Regression Results",
    dep.var.labels = c("Overall Rating", "High Rating"),
    covariate.labels = c(
      "Handling of Complaints",
      "No Special Privileges",
      "Opportunity to Learn",
      "Performance-Based Raises",
      "Too Critical",
      "Advancement"
    ),
    omit.stat = c("LL", "ser", "f"),
    ci = TRUE,
    ci.level = 0.90,
    single.row = TRUE
  )

  # Correlation table
  correlation.matrix <- cor(attitude[, c("rating", "complaints", "privileges")])
  stargazer(correlation.matrix, title = "Correlation Matrix")
}
#>
#> % Table created by stargazer v.5.2.3 by Marek Hlavac, Social Policy Institute. E-mail: marek.hlavac at gmail.com
#> % Date and time: Mon, Nov 03, 2025 - 8:30:37 PM
#> \begin{table}[!htbp] \centering
#>   \caption{}
#>   \label{}
#> \begin{tabular}{@{\extracolsep{5pt}}lccccc}
#> \\[-1.8ex]\hline
#> \hline \\[-1.8ex]
#> Statistic & \multicolumn{1}{c}{N} & \multicolumn{1}{c}{Mean} & \multicolumn{1}{c}{St. Dev.} & \multicolumn{1}{c}{Min} & \multicolumn{1}{c}{Max} \\
#> \hline \\[-1.8ex]
#> rating & 30 & 64.633 & 12.173 & 40 & 85 \\
#> complaints & 30 & 66.600 & 13.315 & 37 & 90 \\
#> privileges & 30 & 53.133 & 12.235 & 30 & 83 \\
#> learning & 30 & 56.367 & 11.737 & 34 & 75 \\
#> raises & 30 & 64.633 & 10.397 & 43 & 88 \\
#> critical & 30 & 74.767 & 9.895 & 49 & 92 \\
#> advance & 30 & 42.933 & 10.289 & 25 & 72 \\
#> \hline \\[-1.8ex]
#> \end{tabular}
#> \end{table}
#>
#> % Table created by stargazer v.5.2.3 by Marek Hlavac, Social Policy Institute. E-mail: marek.hlavac at gmail.com
#> % Date and time: Mon, Nov 03, 2025 - 8:30:37 PM
#> % Requires LaTeX packages: dcolumn
#> \begin{table}[!htbp] \centering
#>   \caption{Results}
#>   \label{}
#> \begin{tabular}{@{\extracolsep{5pt}}lD{.}{.}{-3} D{.}{.}{-3} D{.}{.}{-3} }
#> \\[-1.8ex]\hline
#> \hline \\[-1.8ex]
#>  & \multicolumn{3}{c}{\textit{Dependent variable:}} \\
#> \cline{2-4}
#> \\[-1.8ex] & \multicolumn{2}{c}{rating} & \multicolumn{1}{c}{high.rating} \\
#> \\[-1.8ex] & \multicolumn{2}{c}{\textit{OLS}} & \multicolumn{1}{c}{\textit{probit}} \\
#> \\[-1.8ex] & \multicolumn{1}{c}{(1)} & \multicolumn{1}{c}{(2)} & \multicolumn{1}{c}{(3)}\\
#> \hline \\[-1.8ex]
#>  complaints & 0.692^{***} & 0.682^{***} &  \\
#>   & (0.149) & (0.129) &  \\
#>   & & & \\
#>  privileges & -0.104 & -0.103 &  \\
#>   & (0.135) & (0.129) &  \\
#>   & & & \\
#>  learning & 0.249 & 0.238^{*} & 0.164^{***} \\
#>   & (0.160) & (0.139) & (0.053) \\
#>   & & & \\
#>  raises & -0.033 &  &  \\
#>   & (0.202) &  &  \\
#>   & & & \\
#>  critical & 0.015 &  & -0.001 \\
#>   & (0.147) &  & (0.044) \\
#>   & & & \\
#>  advance &  &  & -0.062 \\
#>   &  &  & (0.042) \\
#>   & & & \\
#>  Constant & 11.011 & 11.258 & -7.476^{**} \\
#>   & (11.704) & (7.318) & (3.570) \\
#>   & & & \\
#> \hline \\[-1.8ex]
#> Observations & \multicolumn{1}{c}{30} & \multicolumn{1}{c}{30} & \multicolumn{1}{c}{30} \\
#> R$^{2}$ & \multicolumn{1}{c}{0.715} & \multicolumn{1}{c}{0.715} &  \\
#> Adjusted R$^{2}$ & \multicolumn{1}{c}{0.656} & \multicolumn{1}{c}{0.682} &  \\
#> Log Likelihood &  &  & \multicolumn{1}{c}{-9.087} \\
#> Akaike Inf. Crit. &  &  & \multicolumn{1}{c}{26.175} \\
#> Residual Std. Error & \multicolumn{1}{c}{7.139 (df = 24)} & \multicolumn{1}{c}{6.863 (df = 26)} &  \\
#> F Statistic & \multicolumn{1}{c}{12.063$^{***}$ (df = 5; 24)} & \multicolumn{1}{c}{21.743$^{***}$ (df = 3; 26)} &  \\
#> \hline
#> \hline \\[-1.8ex]
#> \textit{Note:}  & \multicolumn{3}{r}{$^{*}$p$<$0.1; $^{**}$p$<$0.05; $^{***}$p$<$0.01} \\
#> \end{tabular}
#> \end{table}
#>
#> Regression Results
#> ========================================================================
#>                                        Dependent variable:
#>                          -----------------------------------------------
#>                                          Overall Rating
#>                                    (1)                     (2)
#> ------------------------------------------------------------------------
#> Handling of Complaints   0.692*** (0.447, 0.937) 0.682*** (0.470, 0.894)
#> No Special Privileges    -0.104 (-0.325, 0.118)  -0.103 (-0.316, 0.109)
#> Opportunity to Learn      0.249 (-0.013, 0.512)   0.238* (0.009, 0.467)
#> Performance-Based Raises -0.033 (-0.366, 0.299)
#> Too Critical              0.015 (-0.227, 0.258)
#> Advancement              11.011 (-8.240, 30.262) 11.258 (-0.779, 23.296)
#> ------------------------------------------------------------------------
#> Observations                       30                      30
#> R2                                0.715                   0.715
#> Adjusted R2                       0.656                   0.682
#> ========================================================================
#> Note:                                        *p<0.1; **p<0.05; ***p<0.01
#>
#> % Table created by stargazer v.5.2.3 by Marek Hlavac, Social Policy Institute. E-mail: marek.hlavac at gmail.com
#> % Date and time: Mon, Nov 03, 2025 - 8:30:37 PM
#> \begin{table}[!htbp] \centering
#>   \caption{Correlation Matrix}
#>   \label{}
#> \begin{tabular}{@{\extracolsep{5pt}} cccc}
#> \\[-1.8ex]\hline
#> \hline \\[-1.8ex]
#>  & rating & complaints & privileges \\
#> \hline \\[-1.8ex]
#> rating & $1$ & $0.825$ & $0.426$ \\
#> complaints & $0.825$ & $1$ & $0.558$ \\
#> privileges & $0.426$ & $0.558$ & $1$ \\
#> \hline \\[-1.8ex]
#> \end{tabular}
#> \end{table}
# LaTeX output (uncomment to use)
stargazer(
linear.1,
linear.2,
probit.model,
title = "Regression Results",
align = TRUE,
dep.var.labels = c("Overall Rating", "High Rating"),
covariate.labels = c(
"Handling of Complaints",
"No Special Privileges",
"Opportunity to Learn",
"Performance-Based Raises",
"Too Critical",
"Advancement"
),
omit.stat = c("LL", "ser", "f"),
no.space = TRUE
)40.7.1 Export APA theme (flextable)
Below creates an APA-like table for a subset of mtcars.
You can export data frames to LaTeX via xtable and ready-made styles via stargazer. (Ensure output directory exists.)
print(xtable::xtable(mtcars, type = "latex"),
      file = file.path(getwd(), "output", "mtcars_xtable.tex"))

# American Economic Review style
stargazer::stargazer(
  mtcars,
  title = "Testing",
  style = "aer",
  out = file.path(getwd(), "output", "mtcars_stargazer.tex")
)
However, some exporters don’t play well with table notes. Below is a custom function following AMA-style notes placement.
ama_tbl <- function(data, caption, label, note, output_path) {
  library(tidyverse)
  library(xtable)
  # Function to determine column alignment
  get_column_alignment <- function(data) {
    # xtable align requires length ncol + 1; first is for rownames
    alignment <- c("l", "l")
    for (col in seq_len(ncol(data))[-1]) {
      if (is.numeric(data[[col]])) {
        alignment <- c(alignment, "r")
      } else {
        alignment <- c(alignment, "c")
      }
    }
    alignment
  }

  data %>%
    # bold + left align first column
    rename_with(~paste0("\\\\multicolumn{1}{l}{\\\\textbf{", ., "}}"), 1) %>%
    # bold + center align all other columns
    `colnames<-`(ifelse(colnames(.) != colnames(.)[1],
                        paste0("\\\\multicolumn{1}{c}{\\\\textbf{", colnames(.), "}}"),
                        colnames(.))) %>%
    xtable(caption = caption,
           label = label,
           align = get_column_alignment(data),
           auto = TRUE) %>%
    print(
      include.rownames = FALSE,
      caption.placement = "top",
      hline.after = c(-1, 0),
      add.to.row = list(
        pos = list(nrow(data)),
        command = c(
          paste0("\\\\hline \n \\\\multicolumn{", ncol(data),
                 "}{l}{ \n \\\\begin{tabular}{@{}p{0.9\\\\linewidth}@{}} \n",
                 "Note: ", note, "\n \\\\end{tabular} } \n")
        )
      ),
      sanitize.colnames.function = identity,
      table.placement = "h",
      file = output_path
    )
}