1 Introduction to Statistics
Statistics appears in almost every aspect of daily life. When reading news reports about surveys, public health updates, or economic analysis, we are already looking at applications of statistics. It helps us transform raw data into meaningful information that supports better understanding and decision-making. This chapter introduces the meaning of statistics, its main types, the process of data analysis, and practical applications across different fields.
Statistics is the science of collecting, organizing, analyzing, and interpreting data to make informed decisions. It provides essential tools for understanding variability, modeling uncertainty, and drawing conclusions from real-world phenomena across science, engineering, business, and social studies. Mastery of statistics enables us to extract insights, test hypotheses, and predict outcomes effectively [1], [2].
The Figure 1.1 presents a visual overview of the course, highlighting the structure of key topics and their interconnections. It offers readers a clear guide to navigate the material and understand how concepts link to practical applications and decision-making processes [3].
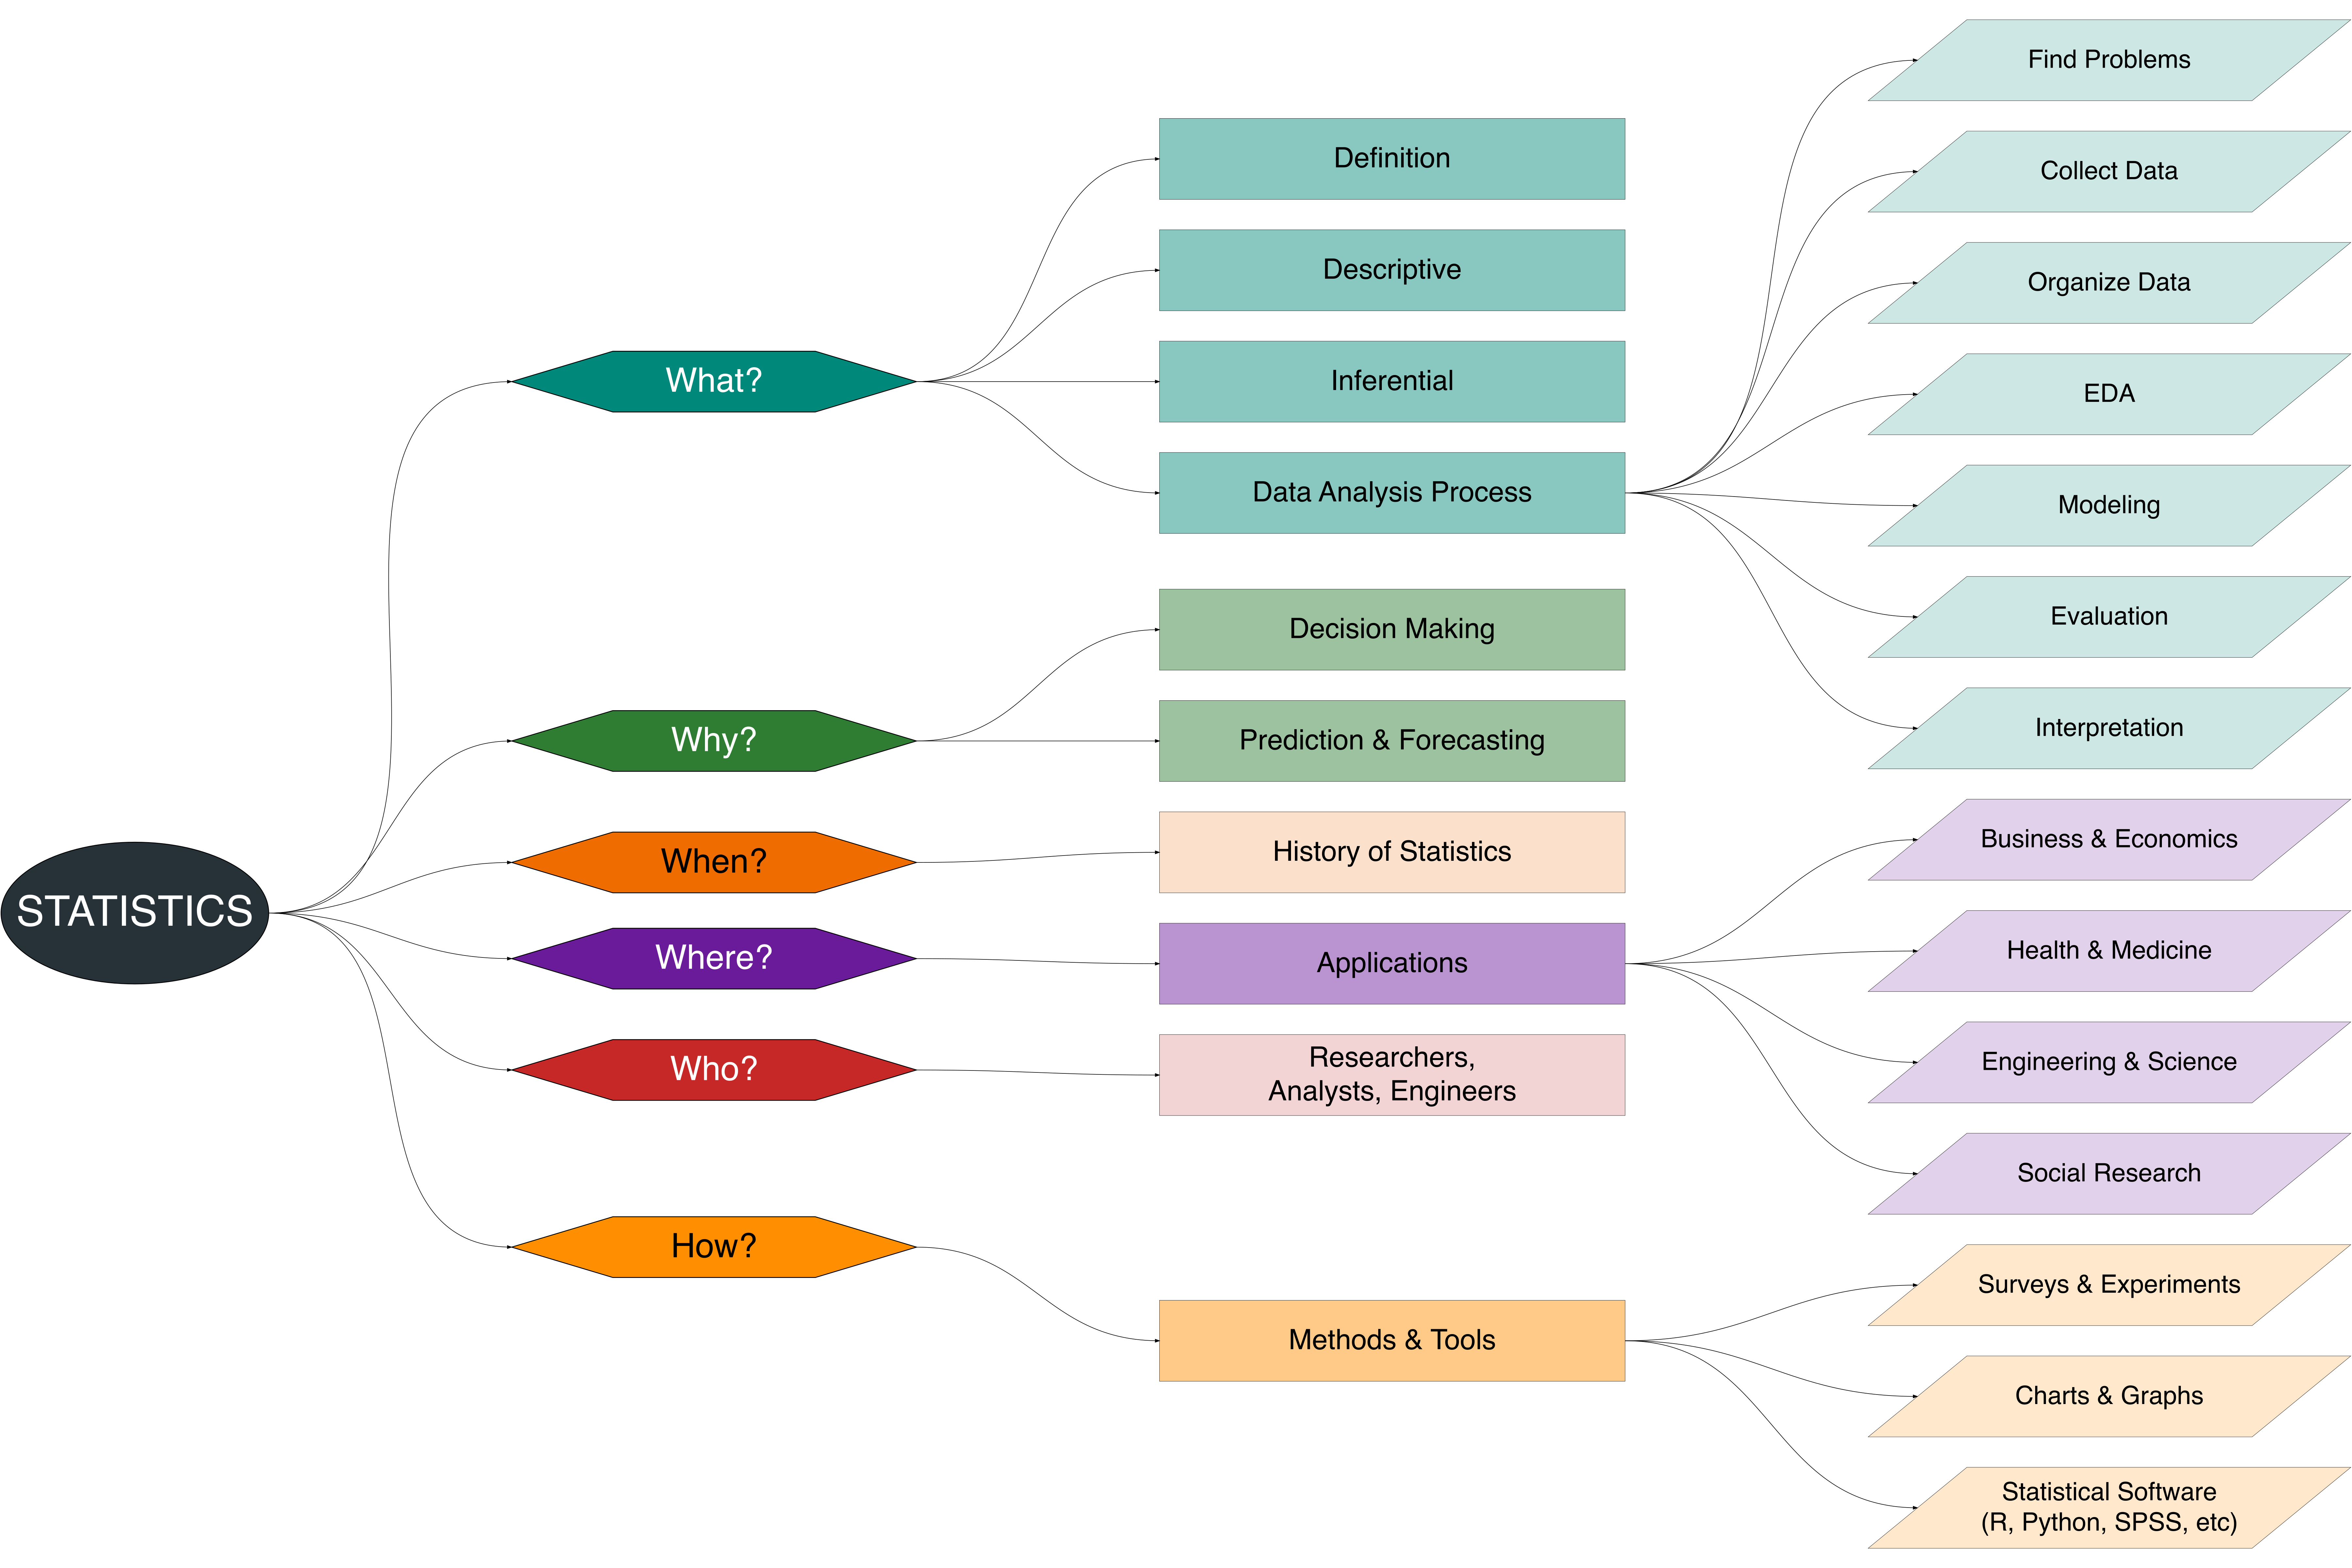
Statistics is a fundamental discipline in data science, serving as a foundation for understanding, analyzing, and interpreting information. By applying the 5W+1H framework (What, Why, When, Where, Who, How), we can systematically explore the essence of statistics: its definition, purpose, history, areas of application, contributors, and methodology.
Table Table 1.1 provides an overview of these guiding questions, linking each with practical examples and interpretations that reflect both everyday understanding and scientific perspectives.
| Description | Example_Stat | Example_Output | |
|---|---|---|---|
| What? | |||
| What? | What is statistics? | Science of collecting, organizing, analyzing, and interpreting data | Tool to make sense of uncertainty |
| What? | What are the main branches of statistics? | Descriptive and Inferential statistics | Descriptive: summarize data; Inferential: draw conclusions |
| What? | What is the role of data in statistics? | Data as the raw material for statistical inference | Without data, no statistical inference is possible |
| Why? | |||
| Why? | Why is statistics important for decision-making? | Helps reduce uncertainty and guide policies | Example: public health decisions during a pandemic |
| Why? | Why do we use statistics in research and business? | To validate research findings, optimize business strategies | Example: forecasting sales, testing medical treatments |
| When? | |||
| When? | When did statistics begin to be formalized? | 18th–19th century (Gauss, Laplace, Fisher, Pearson) | Roots in census-taking, formalized with probability theory |
| When? | When is statistical analysis applied in practice? | Market research, medical studies, social surveys | Example: analyzing customer satisfaction survey |
| Where? | |||
| Where? | Where is statistics applied in real-world problems? | Business, economics, health, engineering, social sciences | Example: clinical trials, risk assessment, AI systems |
| Where? | Where can statistical thinking be observed in daily life? | Everyday: opinion polls, product reviews, budgeting | Example: choosing insurance plans, election predictions |
| Who? | |||
| Who? | Who developed the foundations of modern statistics? | Key figures: Ronald Fisher, Karl Pearson, Florence Nightingale | Pioneers advanced probability & statistical theory |
| Who? | Who uses statistics in professional fields? | Researchers, policy makers, engineers, doctors, data scientists | Used across all scientific and professional domains |
| How? | |||
| How? | How is data collected in statistics? | Surveys, experiments, sensors, digital footprints | Quantitative and qualitative data sources |
| How? | How is data analyzed and modeled? | Using EDA, hypothesis testing, regression, machine learning | Models patterns, tests hypotheses, builds predictions |
| How? | How are results interpreted and communicated? | Through reports, dashboards, visualizations, publications | Translate numbers into meaningful insights |
1.1 Definition of Statistics
1.1.1 The Meaning of Statistics
Everyday explanation: Statistics is a way of making data easier to understand. Imagine a teacher who wants to know how well the class performed on an exam. Instead of looking at every student’s score one by one, the teacher can simply calculate the average score to get an overall picture.
Scientific explanation: Statistics is a branch of mathematics concerned with the methods of collecting, organizing, analyzing, interpreting, and presenting data. Its main purpose is to turn raw observations into reliable information for reasoning and decision-making.
Example:
Raw scores: [65, 70, 75, 80, 90]
Descriptive result: mean = 76, median = 75
Conclusion: The class average is fairly good.
1.1.2 Statistics in Decision-Making
Statistics is especially valuable when decisions must be made under uncertainty. A shop owner might record daily sales to decide which day is best for restocking. A doctor may evaluate the effectiveness of a new treatment by analyzing patient data.
In academic terms, statistics supports:
- summarizing large datasets,
- identifying relationships among variables,
- predicting future outcomes,
- and enabling evidence-based decisions.
1.2 Types of Statistics
1.2.1 Descriptive Statistics
Descriptive statistics focuses on summarizing and presenting data in a meaningful way. It includes measures of central tendency (mean, median, mode), measures of variability (variance, standard deviation, range), and visualization tools like tables, histograms, and boxplots.
Example: From 100 students, the average exam score is 72, the highest is 95, and the lowest is 40. A histogram shows how scores are distributed across the group.
1.2.2 Inferential Statistics
Inferential statistics goes beyond description. It aims to make generalizations about a population based on data from a smaller sample.
Example: A sample of 100 students has an average score of 72. Using inferential techniques, we estimate that the average score of the entire university (10,000 students) lies between 71 and 73 with 95% confidence.
Common methods include hypothesis testing, confidence intervals, regression analysis, and ANOVA.
1.3 Data Analysis Process
Before we go further, let’s take a moment to watch a short video about statistics. This vidoe bellow will help you see how statistics is used in everyday life and why it is so important in many fields. By watching it, you will get a clearer picture of how numbers and data can guide decisions, solve problems, and make our world easier to understand.
Video: Introduction to the Importance of Statistics
Analyzing data involves several stages, each building upon the previous one. This process ensures that the final conclusion is accurate and meaningful.
Defining the Problem
The process begins with a clear question. For example: Does online advertising increase sales?Collecting Data
Data can be obtained through surveys, experiments, observations, or secondary sources such as databases and official reports.Organizing Data
Raw data is often messy. This step includes cleaning errors, removing duplicates, handling missing values, and structuring the data in tables.Exploratory Data Analysis (EDA)
Before modeling, data is explored to identify distributions, trends, or outliers. Visual tools like scatter plots or boxplots are particularly useful here.Modeling
Statistical or machine learning models are applied to draw deeper insights. Linear regression predicts outcomes, classification assigns groups, and time series analysis forecasts future values.Evaluating the Model
Models are tested for accuracy. Regression models use R² or RMSE, while classification models rely on accuracy, precision, recall, and F1-score.Interpreting Results
Numbers are translated into real-world meaning. For example: Every additional $1,000 spent on advertising is associated with an increase of 50 sales units.
1.4 Applied of Statistics
Statistics is not only a theoretical field but also a discipline with wide-ranging applications across real-world domains. Its methods enable decision-making, provide evidence-based insights, and support the development of new knowledge in many sectors. Whether in the corporate world, medical research, engineering innovations, or social sciences, statistics acts as a bridge between raw data and meaningful conclusions.
Table Table 1.2 highlights several key areas where statistics is applied, explaining the role it plays and offering concrete examples that demonstrate its importance in practice.
| Explanation | Illustrative Example | |
|---|---|---|
| Business and Economics | Companies use statistics to analyze sales trends, forecast demand, set prices, and manage investment risks. | Example: Predicting next quarter sales or assessing portfolio risk. |
| Health and Medicine | Statistical methods guide clinical trials, monitor disease spread, and evaluate the effectiveness of treatments. | Example: Testing a new vaccine for safety and efficacy. |
| Engineering and Science | Engineers and scientists apply statistics to quality control, material testing, experimental design, and environmental modeling. | Example: Evaluating durability of construction materials. |
| Social Research | Governments and researchers rely on statistics for population surveys, educational assessments, and policy evaluation. | Example: Using census data to design social welfare programs. |
References
[1]
Moore, D. S., McCabe, G. P., and Craig, B. A., Introduction to the practice of statistics, Macmillan Learning, 2020
[2]
Wackerly, D. D., Mendenhall, R., and Scheaffer, R. L., Mathematical statistics with applications, Cengage Learning, 2014
[3]
Freedman, D., Pisani, R., and Purves, R., Statistics, W. W. Norton & Company, 2007