Reproducible Psychology R Exploration
2025-12-16
Chapter 1 R Markdown Report
1.1 Introduction
The purpose of this chapter is to examine data about shootings in NYC. I cleaned the data a little bit and then created tables and graphs to see where and what time of day shootings occur across the 5 boroughs.
1.3 API Call
endpoint <- "https://data.cityofnewyork.us/resource/833y-fsy8.json"
resp <- httr::GET(endpoint, query = list("$limit" = 30000, "$order" = "occur_date DESC"))
shooting_data <- jsonlite::fromJSON(httr::content(resp, as = "text"), flatten = TRUE)
In this code chunk, I used the endpoint function to pull up the shooting data. I also used the get() and list() function to retrieve the 30,000 data points from the shooting data. ## Cleaning Data
shooting_data$loc_classfctn_desc <- str_to_lower(shooting_data$loc_classfctn_desc)
shooting_data %>% head(30)
## incident_key occur_date occur_time boro loc_of_occur_desc precinct jurisdiction_code
## 1 298699604 2024-12-31T00:00:00.000 19:16:00 BROOKLYN OUTSIDE 69 0
## 2 298699604 2024-12-31T00:00:00.000 19:16:00 BROOKLYN OUTSIDE 69 0
## 3 298672096 2024-12-30T00:00:00.000 16:45:00 BRONX OUTSIDE 47 0
## 4 298672094 2024-12-30T00:00:00.000 12:15:00 BRONX OUTSIDE 52 0
## 5 298672097 2024-12-30T00:00:00.000 18:48:00 BROOKLYN OUTSIDE 60 2
## 6 298672096 2024-12-30T00:00:00.000 16:45:00 BRONX OUTSIDE 47 0
## 7 298672095 2024-12-30T00:00:00.000 20:32:00 BRONX INSIDE 41 0
## 8 298672096 2024-12-30T00:00:00.000 16:45:00 BRONX OUTSIDE 47 0
## 9 298628070 2024-12-29T00:00:00.000 16:21:00 BRONX OUTSIDE 43 0
## 10 298628071 2024-12-29T00:00:00.000 17:24:00 MANHATTAN OUTSIDE 23 0
## 11 298609064 2024-12-28T00:00:00.000 15:30:00 BROOKLYN OUTSIDE 73 0
## 12 298609064 2024-12-28T00:00:00.000 15:30:00 BROOKLYN OUTSIDE 73 0
## 13 298607139 2024-12-28T00:00:00.000 2:53:00 MANHATTAN INSIDE 18 0
## 14 298607139 2024-12-28T00:00:00.000 2:53:00 MANHATTAN INSIDE 18 0
## 15 298569109 2024-12-27T00:00:00.000 20:40:00 BROOKLYN OUTSIDE 61 2
## 16 298566035 2024-12-27T00:00:00.000 20:42:00 BRONX OUTSIDE 40 0
## 17 298566035 2024-12-27T00:00:00.000 20:42:00 BRONX OUTSIDE 40 0
## 18 298515632 2024-12-26T00:00:00.000 18:39:00 BRONX INSIDE 52 0
## 19 298508438 2024-12-26T00:00:00.000 20:37:00 BRONX OUTSIDE 40 2
## 20 298609065 2024-12-25T00:00:00.000 1:18:00 BRONX INSIDE 44 0
## 21 298461889 2024-12-25T00:00:00.000 5:55:00 MANHATTAN OUTSIDE 23 2
## 22 298444104 2024-12-24T00:00:00.000 17:46:00 QUEENS OUTSIDE 106 0
## 23 298411322 2024-12-23T00:00:00.000 22:30:00 MANHATTAN OUTSIDE 23 0
## 24 298357806 2024-12-22T00:00:00.000 3:20:00 BRONX OUTSIDE 43 0
## 25 298357805 2024-12-21T00:00:00.000 18:15:00 BRONX OUTSIDE 48 0
## 26 298357804 2024-12-21T00:00:00.000 15:22:00 BROOKLYN OUTSIDE 61 1
## 27 298301433 2024-12-20T00:00:00.000 19:40:00 MANHATTAN OUTSIDE 34 0
## 28 298301433 2024-12-20T00:00:00.000 19:40:00 MANHATTAN OUTSIDE 34 0
## 29 298316135 2024-12-20T00:00:00.000 20:55:00 QUEENS OUTSIDE 109 0
## 30 298301433 2024-12-20T00:00:00.000 19:40:00 MANHATTAN OUTSIDE 34 0
## loc_classfctn_desc location_desc statistical_murder_flag perp_age_group perp_sex
## 1 street (null) FALSE 25-44 M
## 2 street (null) FALSE 25-44 M
## 3 street (null) FALSE (null) (null)
## 4 street (null) FALSE 45-64 M
## 5 housing MULTI DWELL - PUBLIC HOUS FALSE 25-44 M
## 6 street (null) FALSE (null) (null)
## 7 dwelling MULTI DWELL - APT BUILD TRUE 18-24 M
## 8 street (null) FALSE (null) (null)
## 9 street (null) FALSE 18-24 M
## 10 street (null) FALSE (null) (null)
## 11 street (null) FALSE (null) (null)
## 12 street (null) FALSE (null) (null)
## 13 dwelling MULTI DWELL - APT BUILD TRUE 25-44 M
## 14 dwelling MULTI DWELL - APT BUILD TRUE 18-24 F
## 15 housing MULTI DWELL - PUBLIC HOUS FALSE (null) (null)
## 16 street (null) FALSE <18 M
## 17 street (null) FALSE <18 M
## 18 other HOSPITAL FALSE (null) (null)
## 19 housing MULTI DWELL - PUBLIC HOUS FALSE 18-24 M
## 20 dwelling MULTI DWELL - APT BUILD FALSE 45-64 M
## 21 housing MULTI DWELL - PUBLIC HOUS FALSE 25-44 M
## 22 street (null) FALSE 25-44 M
## 23 street (null) FALSE (null) (null)
## 24 street (null) FALSE 25-44 M
## 25 street (null) TRUE 25-44 M
## 26 transit (null) FALSE <18 M
## 27 street (null) FALSE 18-24 M
## 28 street (null) FALSE <18 M
## 29 street (null) FALSE (null) (null)
## 30 street (null) FALSE <18 M
## perp_race vic_age_group vic_sex vic_race x_coord_cd y_coord_cd latitude
## 1 BLACK 18-24 M BLACK 1,015,120 173,870 40.643866
## 2 BLACK 25-44 M BLACK 1,015,120 173,870 40.643866
## 3 (null) 18-24 M BLACK 1,021,316 259,277 40.878261
## 4 BLACK 25-44 M WHITE 1,017,719 260,875 40.882661
## 5 BLACK 45-64 M BLACK 989,372 155,205 40.592685
## 6 (null) 25-44 F WHITE HISPANIC 1,021,316 259,277 40.878261
## 7 BLACK 25-44 M BLACK 1,012,201 240,878 40.827795
## 8 (null) <18 F WHITE HISPANIC 1,021,316 259,277 40.878261
## 9 BLACK <18 M BLACK 1,020,219 239,110 <NA>
## 10 (null) 25-44 M BLACK 999,007 229,814 40.79745
## 11 (null) 25-44 F BLACK 1,007,941 179,784 40.66012
## 12 (null) 18-24 M BLACK 1,007,941 179,784 40.66012
## 13 BLACK 25-44 M BLACK 987,578 216,989 40.762269
## 14 BLACK 25-44 M BLACK 987,578 216,989 40.762269
## 15 (null) 18-24 M BLACK 1,001,807 156,562 40.596395
## 16 BLACK HISPANIC 25-44 M BLACK HISPANIC 1,006,789 237,559 40.818691
## 17 BLACK HISPANIC 25-44 M WHITE HISPANIC 1,006,789 237,559 40.818691
## 18 (null) 18-24 M BLACK HISPANIC 1,017,782 260,028 40.880337
## 19 WHITE HISPANIC 18-24 M BLACK 1,006,844 232,758 40.805523
## 20 WHITE HISPANIC 25-44 M BLACK HISPANIC 1,006,693 240,835 40.827694
## 21 BLACK 25-44 M BLACK 999,602 230,361 40.798959
## 22 ASIAN / PACIFIC ISLANDER 18-24 M ASIAN / PACIFIC ISLANDER 1,035,389 182,933 40.668647
## 23 (null) 25-44 M BLACK 1,000,776 227,613 40.791414
## 24 BLACK 18-24 M BLACK 1,021,853 242,624 40.832551
## 25 BLACK 25-44 M BLACK 1,017,012 244,931 40.838904
## 26 BLACK 18-24 M BLACK 996,614 157,489 40.598939
## 27 WHITE HISPANIC <18 M BLACK HISPANIC 1,004,175 253,200 40.861639
## 28 WHITE HISPANIC <18 M BLACK HISPANIC 1,004,175 253,200 40.861639
## 29 (null) 25-44 M BLACK 1,023,819 224,864 40.783797
## 30 BLACK <18 M BLACK HISPANIC 1,004,175 253,200 40.861639
## longitude geocoded_column.type geocoded_column.coordinates
## 1 -73.888761 Point -73.88876, 40.64387
## 2 -73.888761 Point -73.88876, 40.64387
## 3 -73.865964 Point -73.86596, 40.87826
## 4 -73.878964 Point -73.87896, 40.88266
## 5 -73.981557 Point -73.98156, 40.59269
## 6 -73.865964 Point -73.86596, 40.87826
## 7 -73.899003 Point -73.8990, 40.8278
## 8 -73.865964 Point -73.86596, 40.87826
## 9 <NA> <NA> NULL
## 10 -73.946702 Point -73.94670, 40.79745
## 11 -73.91461 Point -73.91461, 40.66012
## 12 -73.91461 Point -73.91461, 40.66012
## 13 -73.987986 Point -73.98799, 40.76227
## 14 -73.987986 Point -73.98799, 40.76227
## 15 -73.93678 Point -73.93678, 40.59640
## 16 -73.918569 Point -73.91857, 40.81869
## 17 -73.918569 Point -73.91857, 40.81869
## 18 -73.87874 Point -73.87874, 40.88034
## 19 -73.918387 Point -73.91839, 40.80552
## 20 -73.918903 Point -73.91890, 40.82769
## 21 -73.944552 Point -73.94455, 40.79896
## 22 -73.815655 Point -73.81566, 40.66865
## 23 -73.940319 Point -73.94032, 40.79141
## 24 -73.864117 Point -73.86412, 40.83255
## 25 -73.881597 Point -73.8816, 40.8389
## 26 -73.955477 Point -73.95548, 40.59894
## 27 -73.927966 Point -73.92797, 40.86164
## 28 -73.927966 Point -73.92797, 40.86164
## 29 -73.857115 Point -73.85711, 40.78380
## 30 -73.927966 Point -73.92797, 40.86164shooting_data <- shooting_data %>%
mutate(
hour = as.numeric(format(strptime(occur_time, format = "%H:%M"), "%H")),
time_of_day2 = case_when(
hour >= 5 & hour < 12 ~ "Morning",
hour >= 12 & hour < 18 ~ "Afternoon",
TRUE ~ "Night"
)
)
shooting_data$time_of_day2 %>% head(30)## [1] "Night" "Night" "Afternoon" "Afternoon" "Night" "Afternoon" "Night" "Afternoon" "Afternoon"
## [10] "Afternoon" "Afternoon" "Afternoon" "Night" "Night" "Night" "Night" "Night" "Night"
## [19] "Night" "Night" "Morning" "Afternoon" "Night" "Night" "Night" "Afternoon" "Night"
## [28] "Night" "Night" "Night"In this code chunk, I used the str_to_lower() function to put the words in the loc_classfctn_desc column in lowercase. For the second code in this chunk, I added a new column using the mutate() and case_when() function that tells us whether the shooting was done in the morning, afternoon, or night. ## Insights
##   shooting_data$time_of_day2     n
## 1                      Night 21580
## 2                  Afternoon  5439
## 3                    Morning  2725
In this code chunk, I used the count(), arrange(), and head() function to count the amount of times shootings happened, and what time of day it was.
1.4 Tables and Graphs
ggplot(shooting_data, aes(x= time_of_day2))+
  geom_bar(color="steelblue", fill="white")+
  labs(
    title= "Time of Day",
    x= "Day",
    y= "Count")+
  theme(
    plot.title = element_text(size=18, family="mono", face="bold")
  )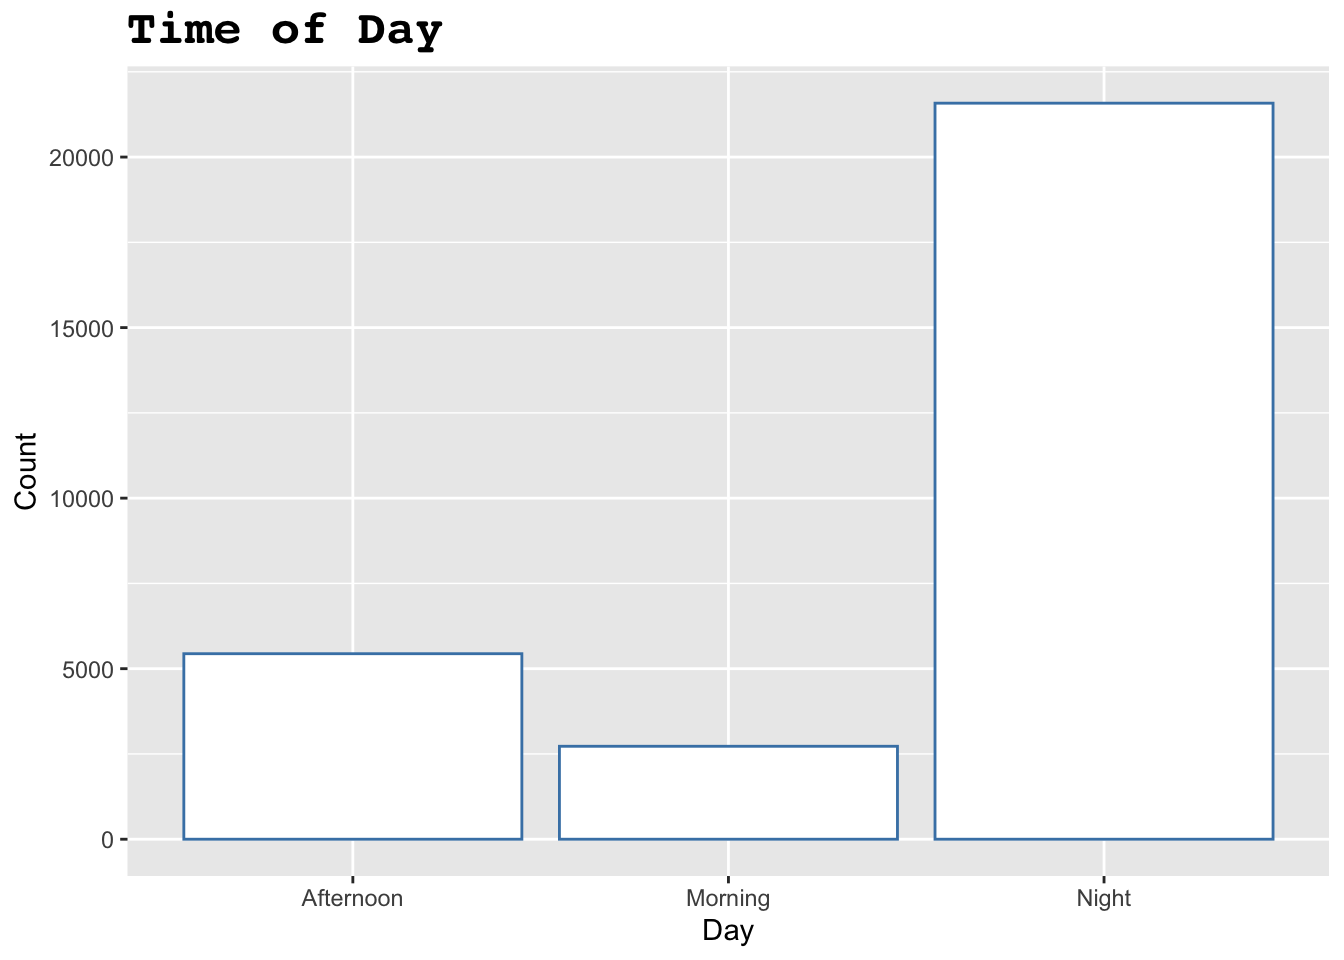
Figure 1.1: This bar graph shows the time of days that shootings occur.
ggplot(shooting_data, aes(x=boro))+
  geom_bar(color="purple", fill="grey")+
  facet_wrap(~loc_of_occur_desc)+
  labs(
    title= "Different Boroughs",
    x= "Borough",
    y="Count")+
  theme(
    plot.title= element_text(family="serif", face="bold", size=18)
  )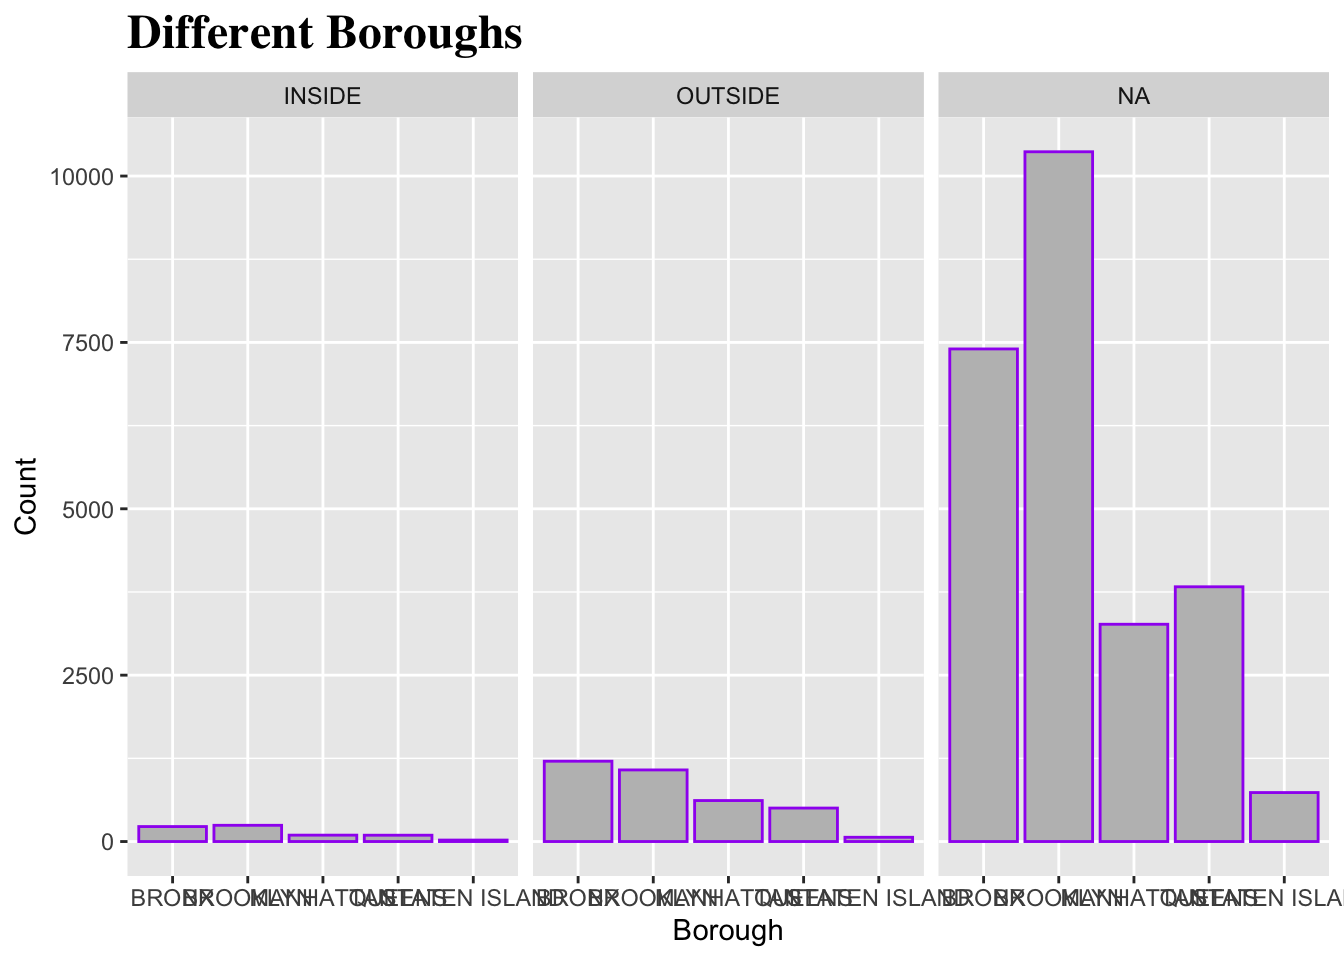
Figure 1.2: This bar graph shows the different boroughs and the amount of shootings that take place as well as whether the shootings were outside, inside, or not known.
##  [1] "|x         |" "|:---------|" "|Night     |" "|Night     |" "|Afternoon |" "|Afternoon |" "|Night     |"
##  [8] "|Afternoon |" "|Night     |" "|Afternoon |" "|Afternoon |" "|Afternoon |" "|Afternoon |" "|Afternoon |"
## [15] "|Night     |" "|Night     |" "|Night     |" "|Night     |" "|Night     |" "|Night     |" "|Night     |"
## [22] "|Night     |" "|Morning   |" "|Afternoon |" "|Night     |" "|Night     |" "|Night     |" "|Afternoon |"
## [29] "|Night     |" "|Night     |"
In this code chunk, for the first part I used ggplot and the geom_bar function to create a bar graph to show the time of day. The x axis was time of day (morning, afternoon, and night), and the y axis was the amount of shootings that happened at those 3 times. For the second part of the the chunk I created another bar graph using ggplot of geom_bar again, but this time to see what boroughs shootings happened in. The x-axis was the 5 boroughs in NYC, and the y-axis was the amount of times a shooting occurred in each borough. I also used the facet_wrap function to incorporate the location of the shootings in the same graph. There were 3 options; outside, inside, or N/A. For the last part of the chunk I created a table for the time of day column using kable. I also used the head function to only get the first 30 data points.
1.5 Reflection
This will be able to help me with my thesis research because I will be able to upload my data and run some code to create tables and graphs (visuals). I will be able to write explanations and analyze the code I ran for a better understanding while having it all in one document so it’s easy to read. It will also allow me to come back and add or change things easily.