3.2 Debt & Arrears
The April 2025 FSR notes arrears have been increasing but remain low overall, with borrowers holding sizable buffers—yet the share with low buffers has risen among those with large mortgages/investor debt highlighting heterogeneity by borrower type and debt load when discussing buffers and emerging arrears.I’ve loaded and selected some of the RBA E2 tables, a national-accounts ratio. This includes household assets (dwellings + superannuation + other financial/non-financial assets) to income and housing debt/assets to income specifically - A useful macro view of balance-sheet strength, but it is not a liquidity or serviceability metric. Aggregate measure hides skew in the data. Older & high-income households, with housing equity have higher liquid buffers. Higher asset to income rations does not directly translate to liquidity to meet debt repayments. However, I’ve included series as debt to income raios alone may skew perspective on financial stability Wang, RBA - 2022. My discussion of asset prices will be minimal, I want to focus on debt servicing, where the data allows, but a broader perspective is required for a balanced view. - Where solvency and liquidity interact.
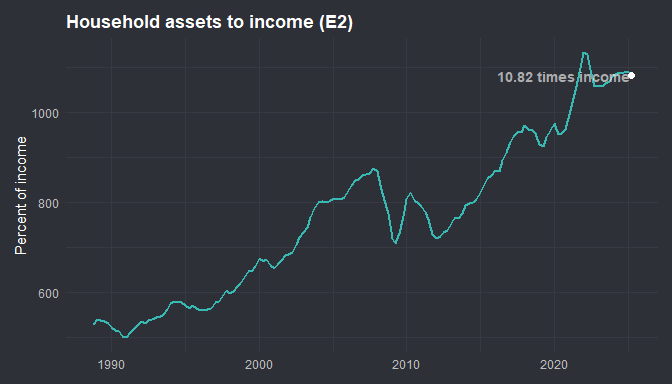
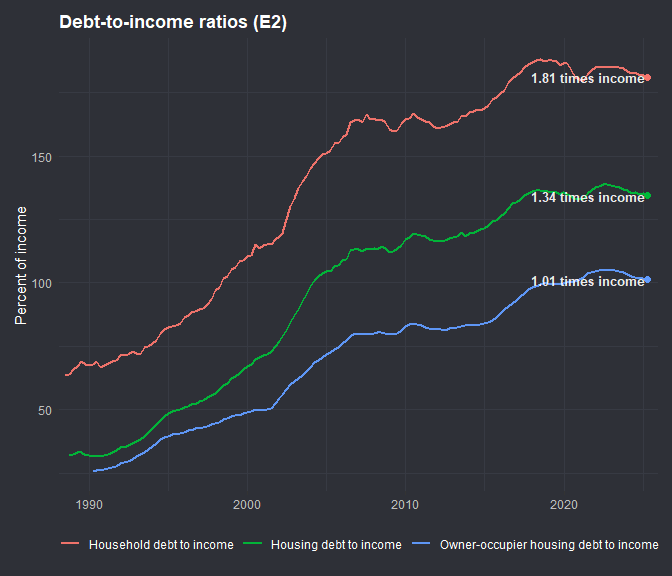
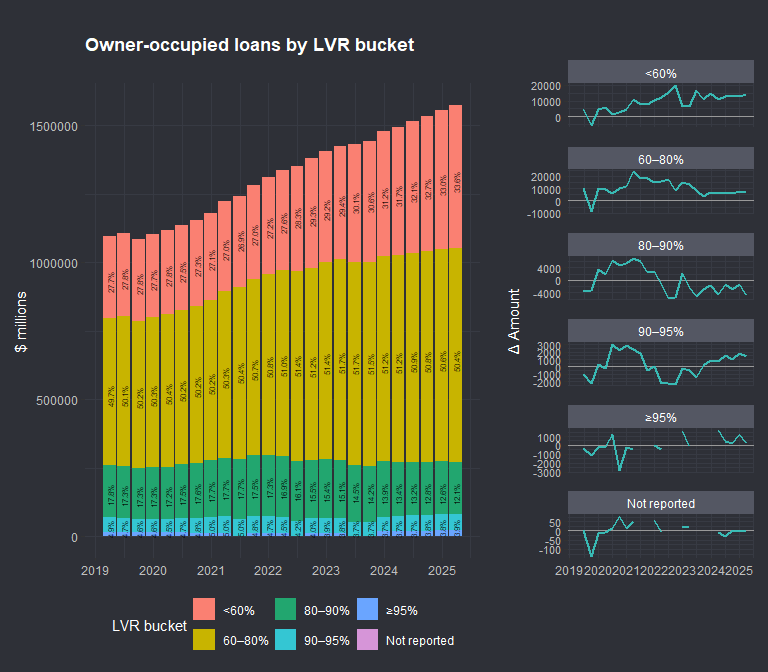
High assets-to-income suggest sizable equity buffers, but arrears are driven by liquidity, not net worth. With DTI near historical peaks, modest income shocks or rate resets can strain servicing despite strong balance-sheet wealth. Heterogeneity in the series considering high earners and high net worth households suppresses the multiple. House (asset) price to income would tell a different story particularly for new loans, which tend to be younger cohorts with less wealth, will need a higher proportion of debt to acquire the asset. The interaction of rising asset prices on higher rates will naturally test buffers. Before going there I will look further at Owner Occupied data and Non Performing Loans.
APRA’s quarterly ADI highlights regularly note asset quality remains sound even as non-performing loans drift higher. I’ve taken data from APRAs website selecting for the variables of interest, again these are aggregations so limitations apply.
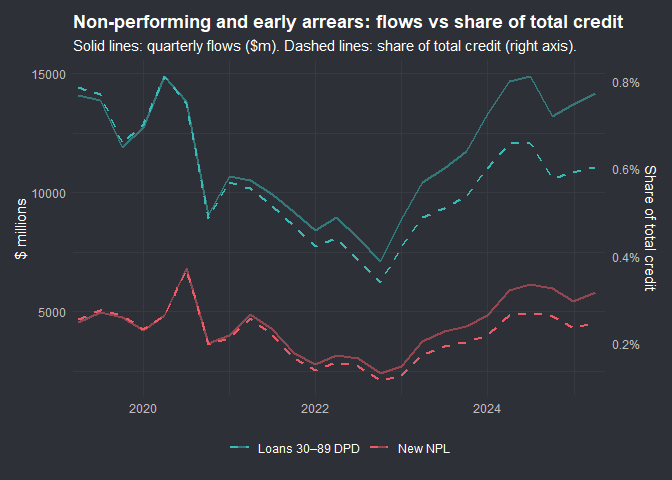
Credit outstanding is the balance owed by borrowers at the end of the reporting period (including capitalised interest or fees). The credit outstanding is the original loan amount, less any repayments, plus any redraw facilities drawn APRA Quarterly - Glossary. As a portion of credit outstanding , I can understand the view on soundness of asset quality. In the absence of granular data there is only so much that I can surmise.
3.2.1 Exploring Wages & Renummeration
Using ABS data I want to find more granular data than aggregate compensation. Using:
- ABS Business Indicators, Australia (cat. 5676.0). It has quarterly Wages (current price) by industry — the numerator for average earnings by industry.
- ABS Labour Force, Detailed (cat. 6291.0.55.001/003). We’ll take Employed total (Original) — the denominator (000s of persons).
I’ll take the original series as opposed to trend or seasonally adjusted, to better reflect the sceanrio of a credit analyst at a micro level. I want to see if this can give representative figures for wages,
| Industry wages & employment — latest quarter | |||||
| Industry | Quarter | Wages ($m) | Employment (000s) | Implied avg wage — qtr ($/worker) | Implied avg wage — ann. ($/worker) |
|---|---|---|---|---|---|
| Accommodation and Food Services | 2025 Q2 | 8,379.0 | 946.5 | $8,853 | $35,411 |
| Administrative and Support Services | 2025 Q2 | 14,823.0 | 423.3 | $35,020 | $140,079 |
| Arts and Recreation Services | 2025 Q2 | 2,439.0 | 271.1 | $8,998 | $35,990 |
| Construction | 2025 Q2 | 22,362.0 | 1,321.1 | $16,927 | $67,708 |
| Education and Training | 2025 Q2 | 6,867.0 | 1,272.7 | $5,396 | $21,583 |
| Electricity, Gas, Water and Waste Services | 2025 Q2 | 2,073.0 | 206.7 | $10,031 | $40,123 |
| Financial and Insurance Services | 2025 Q2 | 14,535.0 | 585.8 | $24,812 | $99,248 |
| Health Care and Social Assistance | 2025 Q2 | 22,593.0 | 2,408.4 | $9,381 | $37,524 |
| Information Media and Telecommunications | 2025 Q2 | 4,979.0 | 182.6 | $27,266 | $109,063 |
| Manufacturing | 2025 Q2 | 16,924.0 | 861.8 | $19,638 | $78,551 |
| Mining | 2025 Q2 | 9,483.0 | 317.4 | $29,876 | $119,504 |
| Other Services | 2025 Q2 | 6,389.0 | 538.3 | $11,868 | $47,473 |
| Professional, Scientific and Technical Services | 2025 Q2 | 27,447.0 | 1,387.9 | $19,776 | $79,105 |
| Rental, Hiring and Real Estate Services | 2025 Q2 | 4,772.0 | 241.6 | $19,755 | $79,021 |
| Retail Trade | 2025 Q2 | 14,564.0 | 1,342.9 | $10,845 | $43,380 |
| Transport, Postal and Warehousing | 2025 Q2 | 10,195.0 | 764.5 | $13,335 | $53,341 |
| Wholesale Trade | 2025 Q2 | 12,845.0 | 350.2 | $36,674 | $146,698 |
This has proved more back of the envelope than I was hoping. Some figures look reasonable, others are approaching useless.
The Business Indicators “Wages & salaries” (private-sector businesses only) while the denominator is total employed persons from the Labour Force/industry series (covers public and private). That scope mismatch alone can bias levels down in public-heavy industries like Health Care & Education. ABS also notes that “compensation of employees” in the National Accounts includes superannuation and other non-wage items that are not in Business Indicators wage bills. Health Care & Social Assistance has a large public-sector footprint (missed by the BI wage numerator), a high incidence of part-time and multiple-job holding, and lots of shift/irregular hours. ABS has recently highlighted that Health Care has the largest share of multiple job-holders; spreading one person’s earnings over two jobs tends to pull down any simple “per worker” average based on head-counts.
Having understated public sector, multiple job workers and zero hour workers I will quickly view the Average Weekly Earning (AWE) by industry. I won’t get a distribution, but with representative figures for earnings at least I can move to stress test the figures.
| Average weekly earnings by industry | |||
| Persons · Full-time · Adult · Ordinary-time • Latest observation • ABS 6302.0 (AWE) | |||
| Industry | Date | Average weekly ($) | Annualised ($) |
|---|---|---|---|
| Accommodation and Food Services | 2025 May | $1,460 | $75,904 |
| Administrative and Support Services | 2025 May | $1,818 | $94,557 |
| Arts and Recreation Services | 2025 May | $1,802 | $93,730 |
| Construction | 2025 May | $1,958 | $101,795 |
| Education and Training | 2025 May | $2,098 | $109,112 |
| Electricity, Gas, Water and Waste Services | 2025 May | $2,367 | $123,074 |
| Financial and Insurance Services | 2025 May | $2,324 | $120,832 |
| Health Care and Social Assistance | 2025 May | $1,979 | $102,898 |
| Information Media and Telecommunications | 2025 May | $2,561 | $133,156 |
| Manufacturing | 2025 May | $1,789 | $93,012 |
| Mining | 2025 May | $3,174 | $165,074 |
| Other Services | 2025 May | $1,521 | $79,102 |
| Professional, Scientific and Technical Services | 2025 May | $2,328 | $121,035 |
| Public Administration and Safety | 2025 May | $2,103 | $109,372 |
| Rental, Hiring and Real Estate Services | 2025 May | $1,876 | $97,526 |
| Retail Trade | 2025 May | $1,504 | $78,229 |
| Transport, Postal and Warehousing | 2025 May | $1,926 | $100,136 |
| Wholesale Trade | 2025 May | $1,884 | $97,947 |
| Annualised = 52 × weekly earnings. Source: ABS 6302.0 (AWE). | |||
That will suffice for the next section where I will make some assumptions and a sensitivity test on mortgage affordability.