5.1 Liquid Assets
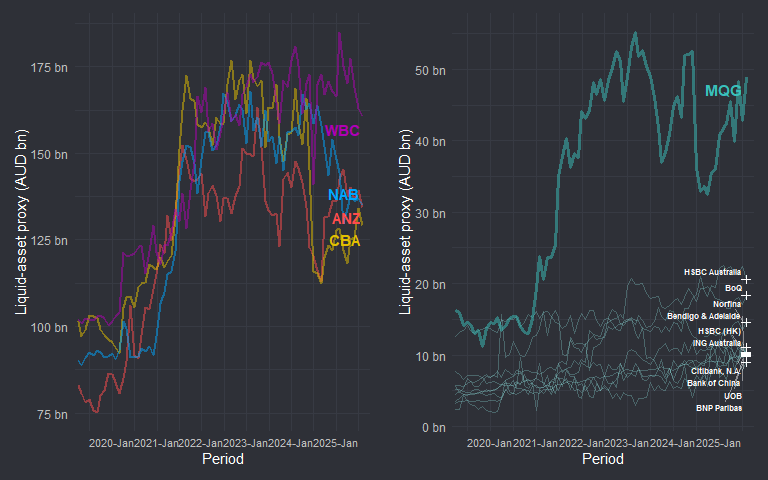
All four majors (CBA, WBC, NAB, ANZ) display a step-up in liquid-asset proxies through 2021, lifting from ~A$100bn to closer to A$150–175bn. This coincides with the RBA’s Term Funding Facility (TFF) and broader liquidity injections during the pandemic period, when banks parked substantial funds in high-quality liquid assets. After 2022, when the CLF concluded and TFF closed, the profiles diverge somewhat, but the common pattern is a plateau then some retracement into 2024–25. Macquarie detailed in thir FY22 Management Discussion and Analysis a “Cash and liquid assets $A78.6 bn” vs 51.0 a year earlier, and explicitly notes “Includes RBA TFF of $A11.3 billion”. I could have went into more detail here but in order to keep focus on housing and to avoid spending too much time here I conclude on views from the RBA and then look at the components of my proxy.
“By the end of February 2024, around $90 billion of the $188 billion… had been repaid. TFF repayments cause banks’ liquidity ratios to decline” FSR, March 2024. The RBA also notes banks replaced that funding by lifting wholesale issuance and term deposits as the TFF matured. RBA April Bulletin
I’ve indexed the components of the LA proxy (100 = first observation) to see on a relative scale how the components have evolved. I have also tabulated with actual values as a cross check.
Top 5 ADIs - Components of Liquid Asset Proxy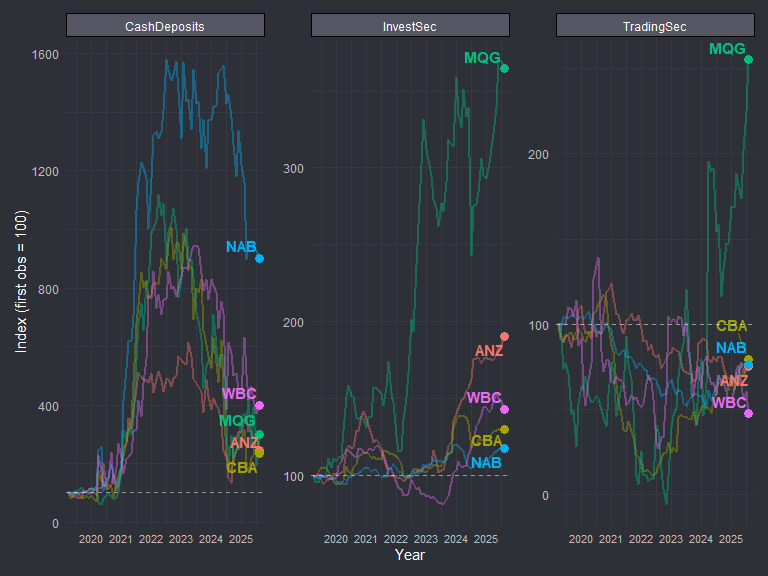
At peak, between 2020 and its 2022, NAB’s cash holdings expanded more than 15× baseline, whereas peers expanded 6–8×. NAB’s latest cash represents an over 9x increase from the baseline. Macquarie’s investment securities have quadrupled since 2021, while Big Four holdings in trading securities have broadly stagnated.
| Liquid Asset Components — Growth from First to Last Observation | |||||
| Component | First (A$b) | Last (A$b) | Change (A$b) | Growth % | |
|---|---|---|---|---|---|
| Australia and New Zealand Banking Group Limited | CashDeposits | 15.3 | 37.4 | 22.1 | 144.9% |
| Australia and New Zealand Banking Group Limited | InvestSec | 40.0 | 76.2 | 36.2 | 90.4% |
| Australia and New Zealand Banking Group Limited | TradingSec | 27.8 | 20.9 | -6.9 | -24.9% |
| Commonwealth Bank of Australia | CashDeposits | 10.3 | 23.9 | 13.7 | 132.9% |
| Commonwealth Bank of Australia | InvestSec | 64.9 | 84.3 | 19.4 | 29.9% |
| Commonwealth Bank of Australia | TradingSec | 26.4 | 21.0 | -5.4 | -20.4% |
| Macquarie Bank Limited | CashDeposits | 3.6 | 10.9 | 7.3 | 200.3% |
| Macquarie Bank Limited | InvestSec | 5.1 | 18.5 | 13.4 | 264.5% |
| Macquarie Bank Limited | TradingSec | 7.6 | 19.5 | 11.8 | 155.5% |
| National Australia Bank Limited | CashDeposits | 6.4 | 57.8 | 51.4 | 801.2% |
| National Australia Bank Limited | InvestSec | 31.6 | 37.2 | 5.5 | 17.5% |
| National Australia Bank Limited | TradingSec | 52.2 | 39.8 | -12.4 | -23.7% |
| Westpac Banking Corporation | CashDeposits | 10.5 | 41.9 | 31.4 | 299.8% |
| Westpac Banking Corporation | InvestSec | 78.6 | 112.4 | 33.8 | 43.1% |
| Westpac Banking Corporation | TradingSec | 13.0 | 6.2 | -6.8 | -52.4% |
From the datas perspective Macquarie has appeared to have a more broad based growth in its components (positive 150 to 260% growth) compared to the others, perhaps a nod to it’s structural difference and risk appetite. In annual reports reporting criteria differs from APRAs, varying consolidations and asset classifications. Pillar 3 disclosures (Basel III) are likely close analogues, but company filings are beyond my scope.
With that, I will move on to the Housing Assets.