5.1 Introduction
Our GUI enables users to perform inference using Bayesian regression analysis without requiring programming skills. The lack of such skills is often a significant impediment to the widespread adoption of the Bayesian framework (Woodward 2005; Karabatsos 2016).
Several other graphical user interfaces are available for Bayesian regression analysis. ShinyStan (Stan Development Team 2017) is a highly flexible and open-source program; however, it requires users to have some programming skills, as it is based on the Stan software for Bayesian data analysis (B. Carpenter et al. 2017). BugsXLA (Woodward 2005) is also open source but less flexible, though it does not require any programming experience. Bayesian Regression: Nonparametric and Parametric Models (Karabatsos 2016) is a user-friendly and flexible GUI based on the MATLAB Compiler for 64-bit Windows systems. It primarily focuses on Bayesian nonparametric regression and is designed for users already familiar with basic parametric models, such as those implemented in our GUI. Additionally, there are tools such as the MATLAB Toolkit, Stata, and BayES, but these are not open source.
We developed our GUI as an interactive web application using shiny (Chang 2018) and various libraries in R (R Core Team 2021). The specific libraries and commands used in our GUI are listed in the Appendix. It includes ten univariate models, four multivariate models, four time-series models, three hierarchical longitudinal models, and seven Bayesian model averaging frameworks. In addition, it provides basic summaries and diagnostics of posterior chains, along with visualizations such as trace plots, autocorrelation plots, and density plots.
In terms of flexibility and functionality, our GUI lies between ShinyStan and BugsXLA: it does not require programming skills but is not as advanced as the software described in Karabatsos (2016). However, unlike the latter, our GUI runs on any operating system. We call our GUI BEsmarter,28 and it is freely available at https://github.com/besmarter/BSTApp, where users can access all source code and datasets.
Simulated and applied datasets are stored in the DataSim and DataApp folders of our GitHub repository (see the Appendix for details). The DataSim folder contains files used to simulate various processes, providing access to true parameters. These files serve as valuable pedagogical tools for illustrating the statistical properties of the inferential frameworks available in our GUI. The DataApp folder includes the datasets used throughout this book, which users can adopt as templates when structuring their own data.
There are four ways to install our GUI. The simplest method, requiring only the installation of R and, optionally, an R code editor, is to install shiny package, and then type
shiny::runGitHub("besmarter/BSTApp", launch.browser=T)
in the R console or any R code editor and execute it. We strongly recommend typing this command manually rather than copying and pasting it, as quotation marks can sometimes cause issues.
The second option is to visit https://andres-ramirez-hassan.shinyapps.io/BSTApp/. Please note: the free Posit Cloud tier sometimes runs out of memory, which can cause the app to stop. Sorry for the inconvenience.
Visit https://fly-besmarter.fly.dev/. As with Posit Cloud, occasional memory limits on the free tier may affect performance.
The fourth approach, and our recommendation, is to use a Docker image by running:
docker pull aramir21/besmartergui:latest
docker run --rm -p 3838:3838 aramir21/besmartergui
in your Command Prompt. This creates an isolated environment for our GUI, ensuring consistent performance across different systems. Note that Docker must be installed to deploy our GUI using this method. Users can then access the app by navigating to 127.0.0.1:3838 or http://localhost:3838/.
After using any of the four methods to run our GUI, users will see a new window displaying a presentation of our research team (see Figure 5.1). Additionally, the top panel in Figure 5.1 shows the categories of models that can be estimated in our GUI.
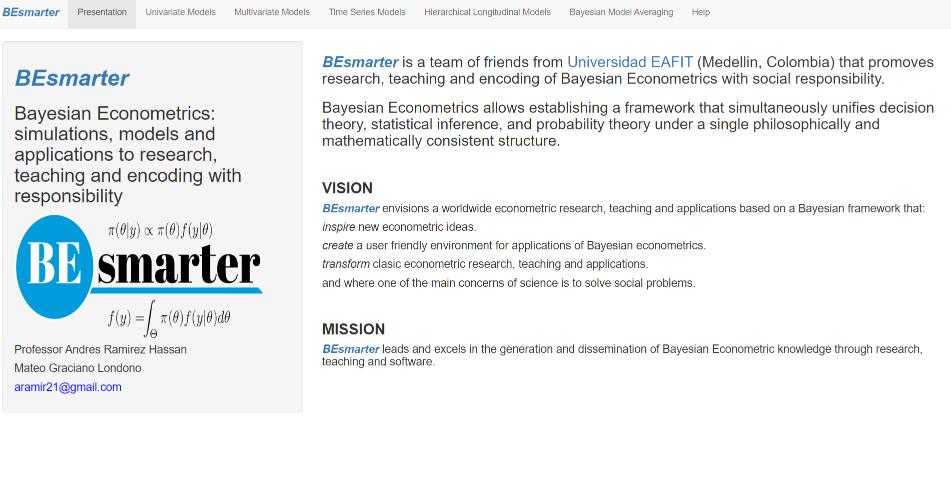
Figure 5.1: Display of graphical user interface.
References
Bayesian Econometrics: Simulations, Models, and Applications to Research, Teaching, and Encoding with Responsibility.↩︎