6.14 Influential observations
Checking for influential observations in logistic regression is the same as for MLR (Section 5.23). Fit the model, plot the Cook’s distances and DFBetas, and, if there are observations with extreme values, conduct a sensitivity analysis to see if their removal impacts your conclusions (Section 5.26).
Example 6.3 (continued): Look for influential observations in the model that includes an interaction (Figures 6.7 and 6.8).
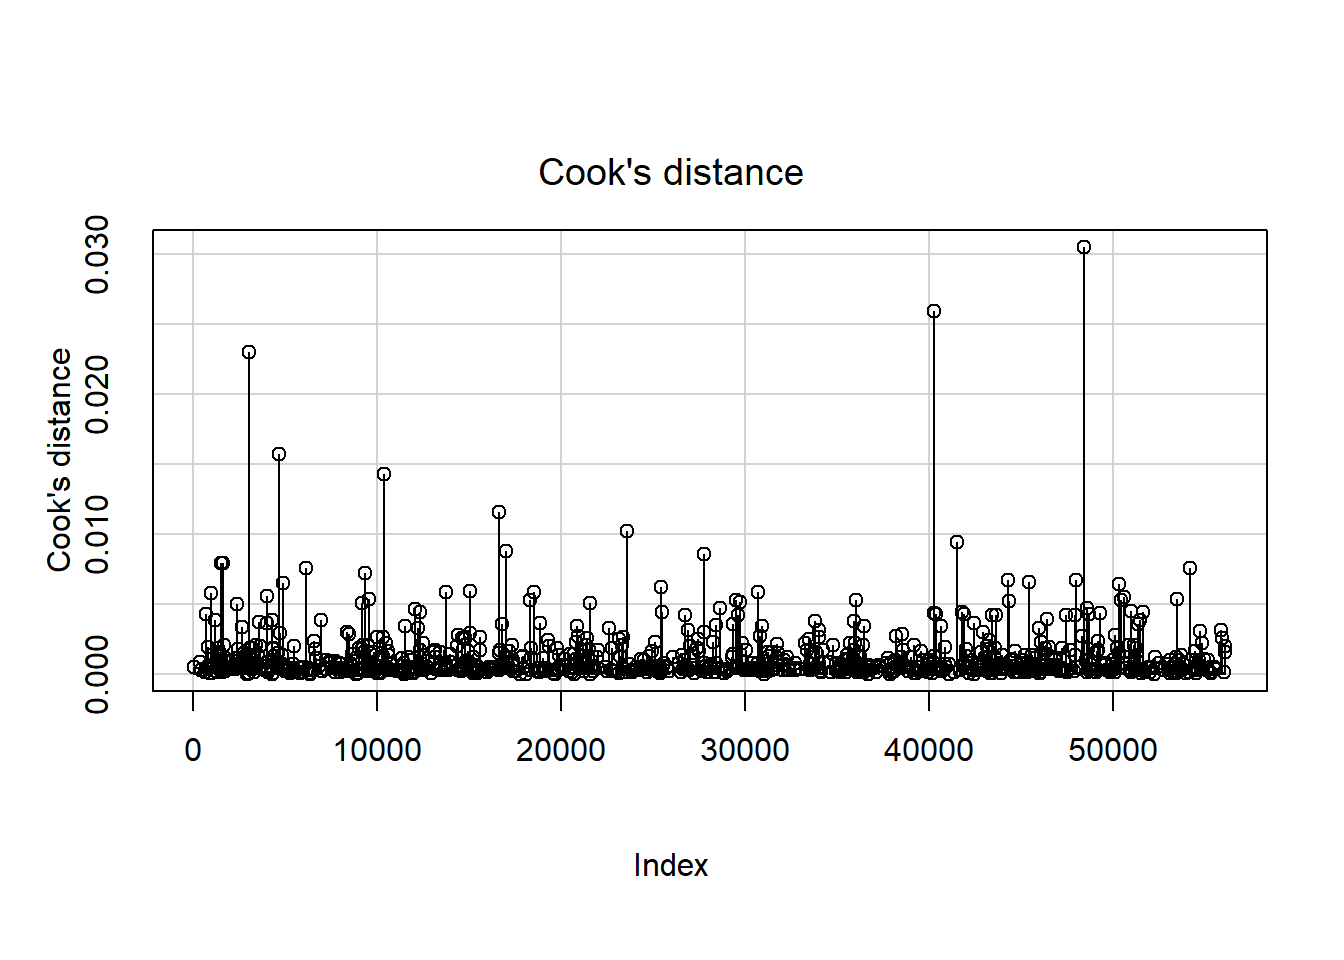
Figure 6.7: Cook’s distance plot for a logistic regression
# Compute DFBETAS
DFBETAS <- dfbetas(fit.ex6.3.int)

# To see the spelling of the terms
# colnames(DFBETAS)
# Index plot for each predictor
# (results only shown for one plot)

plot(DFBETAS[, "alc_agefirst"], main="AlcAge", ylab="")
abline(h = c(-0.2, 0.2), lty = 2)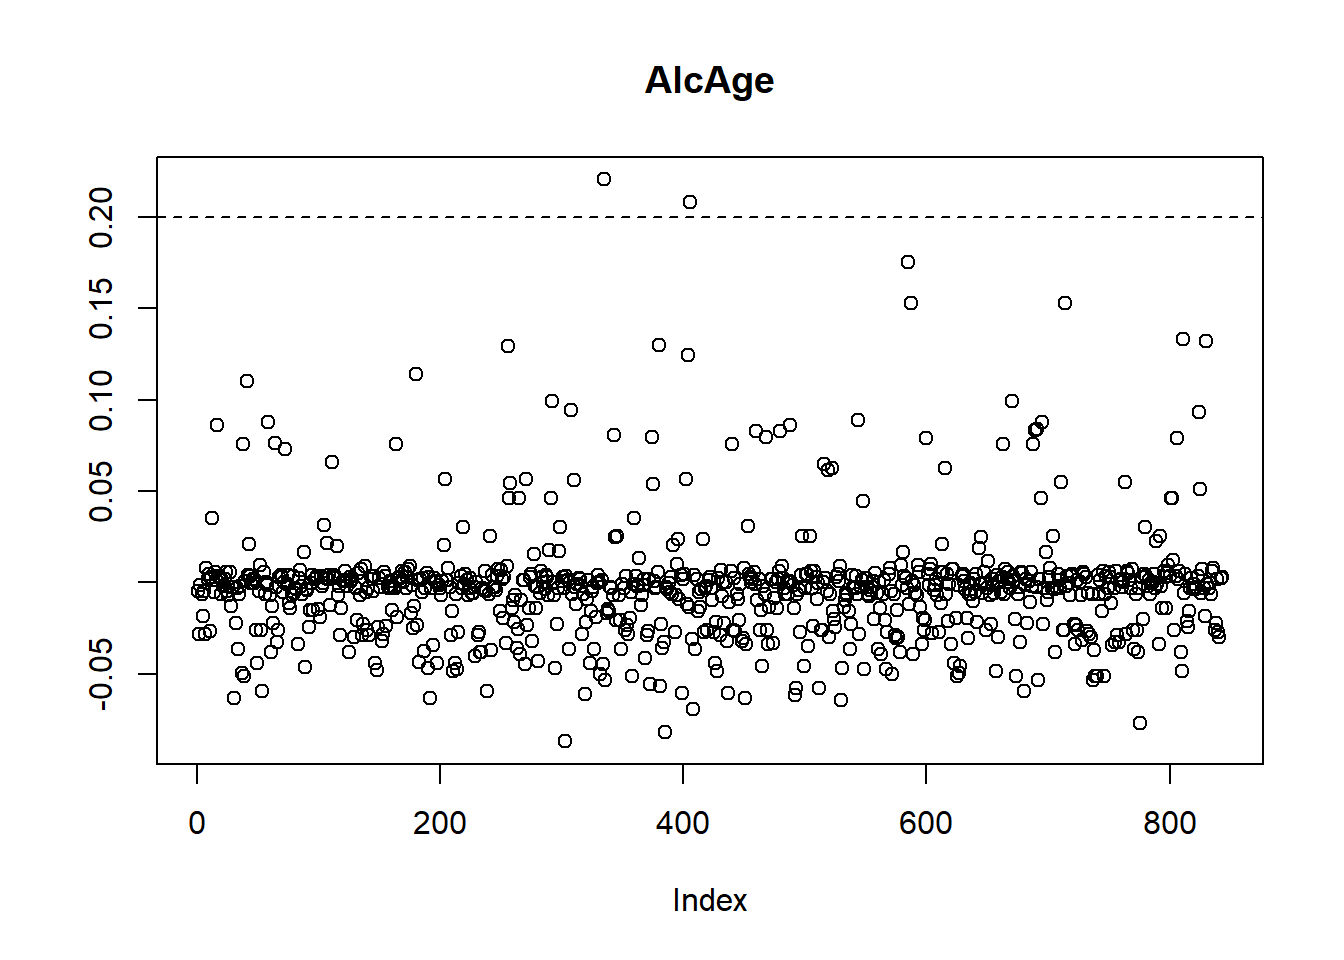
Figure 6.8: Plot of DFBETAS for a logistic regression
Conclusion: There appear to be a few potentially influential observations based on Cook’s Distance, and a few observations that are influential for the main effect of age of first alcohol use.