7.19 Outliers
As with logistic regression, Cox regression has no normality assumption, so outliers are not a problem from that perspective. However, it is still useful to examine outliers to find observations that are not predicted well by the model. Figure 7.23 illustrates two different kinds of residuals (Martingale and deviance) which can be used to see if any observations stand out from the others.
par(mfrow=c(1,2))
plot(resid(cox.ex7.6, type = "martingale"),
     ylab = "Martingale residual", xlab = "Observation")
plot(resid(cox.ex7.6, type = "deviance"),
     ylab = "Deviance residual",   xlab = "Observation")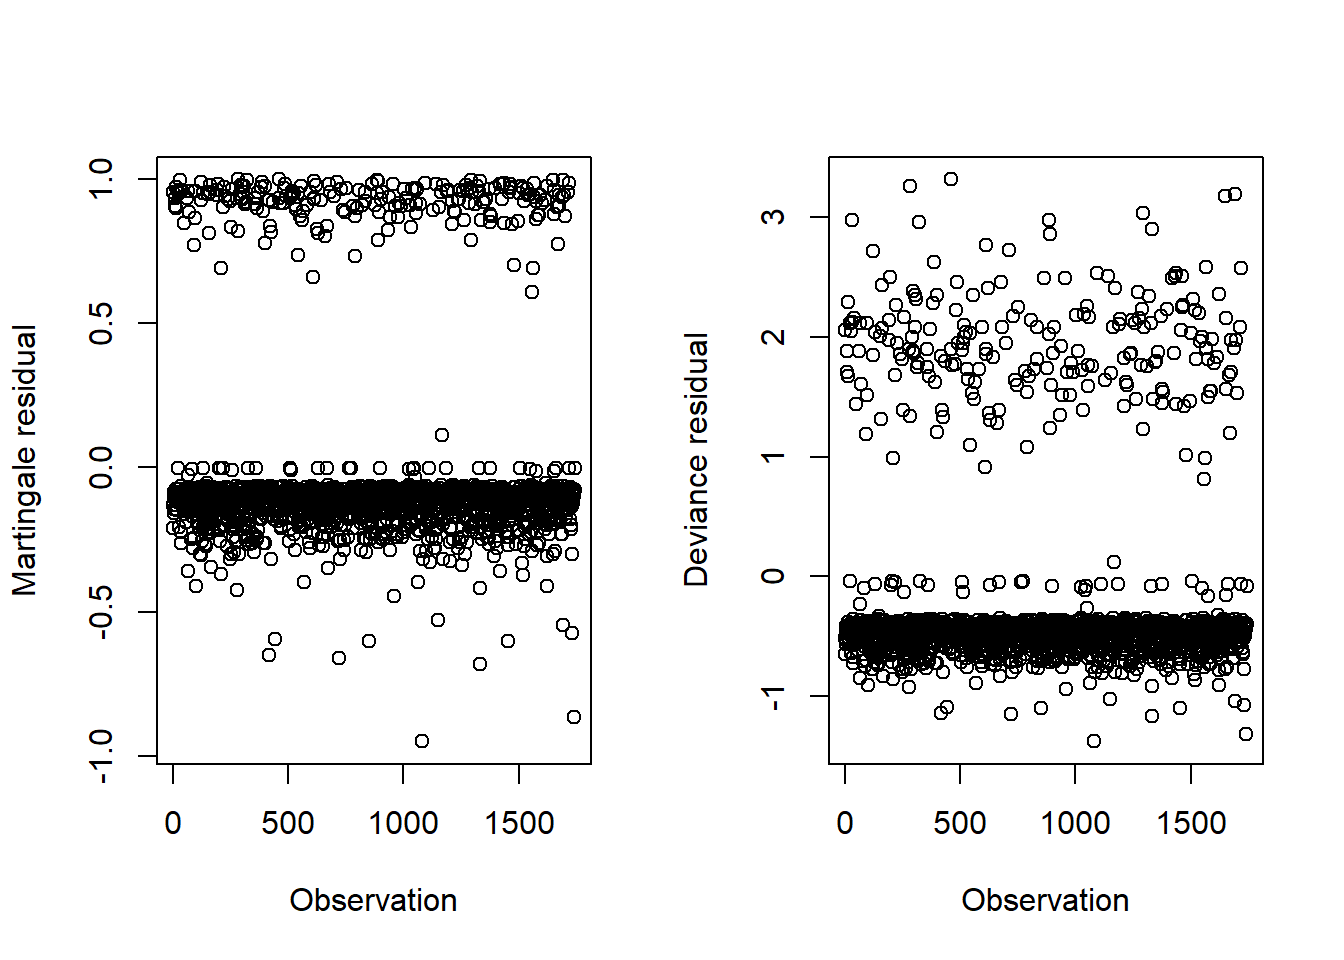
Figure 7.23: Martingale and deviance residuals from a Cox regression
Look at the two observations that have the most negative Martingale residuals. If any of the deviance residuals stood out, you could look at those, as well (although they might be from the same individuals).
# Which individuals have the large negative residuals?
# Sort and pick out the first two
sort(resid(cox.ex7.6, type = "martingale"))[1:2]
## 1080 1738
## -0.9491 -0.8640Had you been looking for individuals with large positive residuals, you would look at the first few observations after sorting on the negative of the residual value. For example, -1*sort(-1*resid(cox.ex7.6, type = "martingale"))[1:2].
# Examine these two individuals
natality.complete[c("1080", "1738"), ] %>%
  select(gestage37, preterm01, RF_PPTERM, MAGER, MRACEHISP, DMAR)
## # A tibble: 2 × 6
## gestage37 preterm01 RF_PPTERM MAGER MRACEHISP DMAR
## <dbl> <dbl> <fct> <dbl> <fct> <fct>
## 1 37 0 Yes 36 NH Black Unmarried
## 2 37 0 Yes 33 NH Black Unmarried# "1080" and "1738" are row LABELS
# But to examine the hazard for these two,
# we need row NUMBERS.
# Row labels are not always the same as row numbers
# Check which elements of the prediction correspond to
# these two individuals
which(rownames(natality.complete) %in% c("1080", "1738"))## [1] 1080 1738# In this case it happened to be the same numbers
# but it may not always be
# What are the estimated hazard ratios for these two individuals
# relative to a reference individual?
predict(cox.ex7.6, type = "risk")[c(1080, 1738)]## [1] 11.31 10.30We find that these two individuals, based on their predictor values, are each estimated to have a very high hazard of preterm birth relative to a reference individual, yet neither experienced a preterm birth. This discrepancy resulted in very large negative residuals. As discussed in Section 7.10, the reference individual being compared to is at the mean value for each continuous predictor and the reference level for each categorical predictor.